

In the past decades, monetary policy has played a major role in addressing macroeconomic fluctuations. Recently, interest rates have dropped to historically low levels, turning negative in some countries, calling into question the most basic foundations of economics. But how have we come this far and what can we expect?
The goal of lowering interest rates
Central banks act as smoothers of the economy. When it gets overheated, they can, for instance, increase reference interest rates, making credit more expensive and slowing down economic activity. Contrariwise, in times of little confidence, they lower interest rates, facilitating access to loans and stimulating consumption and investment. Even though their action may jeopardize growth in expansion times, it is essential to avoid heavy recessions. Therefore, central banks are key in keeping stable confidence levels.
They can impact the economy by directly changing reference interest rates, reserve requirements or performing open-market operations. In this regard, they may engage in expansionary monetary policy (Image 1), in which case they might, for instance, buy assets, through open-market operations, from financial institutions, injecting liquidity in markets. As aforementioned, this suits recession times and has been taken to extraordinary levels since the COVID-19 outbreak started to dent economies across the globe. Contractionary monetary policy works the other way around, but it is far from being a reality during these times. So, the focus of this article will be on the expansionary side, trying to figure out whether or not monetary policy will be effective in smoothing the economic catastrophe brought by the pandemic, taking the past into account.
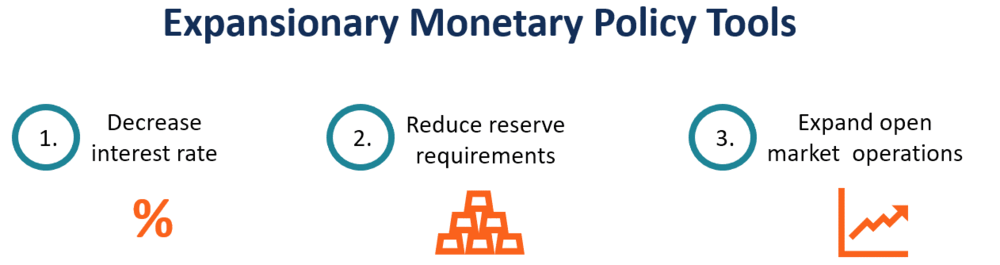
Image 1: Expansionary monetary policy tools
Source: Corporate Finance Institute (adapted)
Monetary policy and how it has changed over time
Adequate management of money supply has not always been the main driver of policy-making towards achieving economic growth. As a matter of fact, Monetarism, as this school of thought later became known, only grew dominant in the 1980s, when inflation and unemployment rising together raised some skepticism about Keynesianism. It was applied by Paul Volcker, Fed’s chairman, as a remedy to slow down inflation in the USA, during Jimmy Carter’s presidency. Similarly, it was put into practice with Margaret Thatcher in the UK. In both countries, the decrease in money supply prevented prices from continuing their seemingly unstoppable escalation.

Image 2: Milton Friedman, the father of Monetarism
Source: Hoover Institution
Nonetheless, as alternative regimes had and have their shortfalls, Monetarism also presented downsides. On the one hand, tackling inflation came at the cost of high unemployment (correlation coefficient between both variables of -0,62) (Graph 1). On the other hand, in 1980 and 1981, money growth targets in the UK were largely missed, worsening monetarism’s reputation, as (Pepper, 1998) noted in his book Inside Thatcher’s Monetarist Revolution.
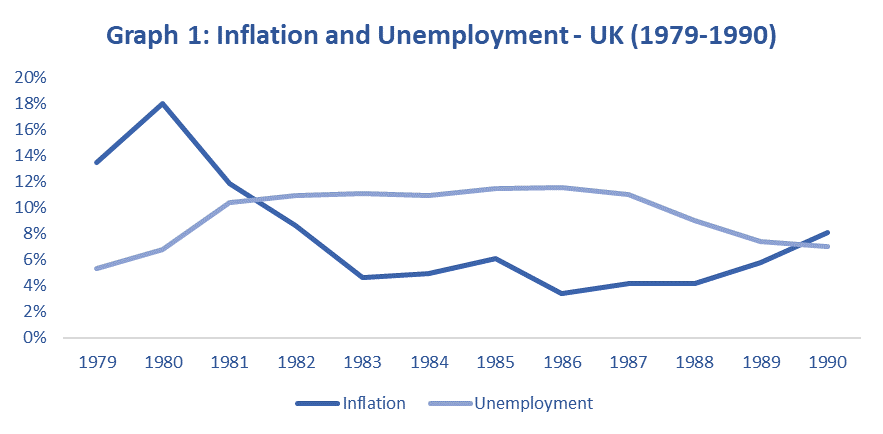
Data source: World Bank
These attempts to tie monetary policy to nominal anchors (being them money growth, as discussed, or gold and fixed exchange rates) and the fact that they failed proved that economic relationships (such as between inflation and unemployment or money growth) are often too unstable to serve as drivers of policy-making. Acknowledging their limitations in understanding the economy, most central banks devoted their efforts into keeping low and stable inflation, avoiding setting a particular exchange rate or money growth rate. Adopting this approach, they found out they had more flexibility to adapt their policies in the pursuance of their inflation target, which is set at just below 2% by the ECB.
Since the full adoption of the euro took place back in 2002 and until the outbreak of the 2008-2009 financial crisis, the ECB had been relatively successful in achieving close to 2% inflation (Graph 2). Nonetheless, in 2009, inflation accompanied the drop in Euro Zone GDP and decelerated significantly, with prices rising only marginally. In 2010 and 2011, inflation recovered a bit, responding to economic growth, but it would end up slowing down dramatically with the aftermath of the sovereign debt crisis, even when the economy started accelerating again.

Data source: World Bank
As a result, in March 2015, the ECB engaged in non-standard monetary policy measures, implementing Quantitative Easing (QE), hoping to bring inflation back to the target and to enhance economic growth. The program is similar to the one tried by the Fed in the US or the Bank of Japan, being based on the acquisition by the ECB of financial assets (namely, bonds) from banks, which will increase their prices and consequently decrease yields. This decreases funding costs for both individuals and corporations, which is expected to stimulate consumption and investment. In the medium term, inflation should speed up and follow economic growth. Nevertheless, this shifts risk to central banks, whose balance sheets inevitably spike (Graph 3).
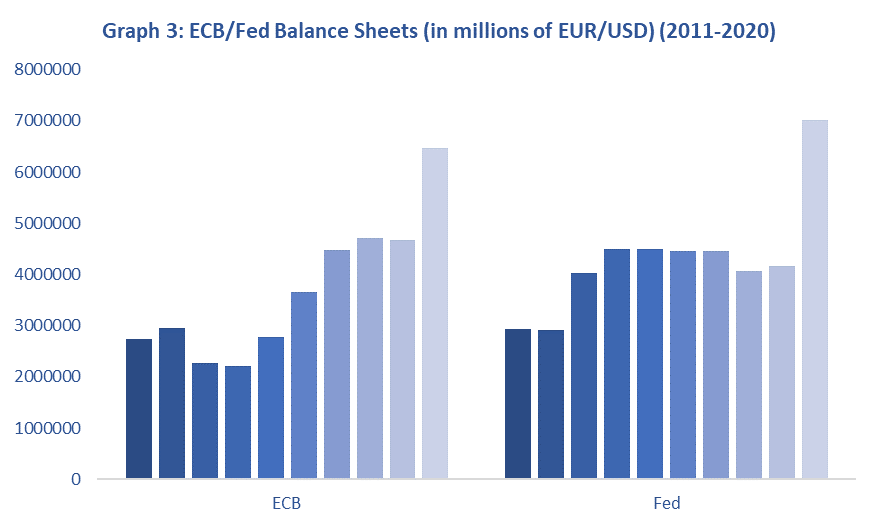
Data source: OECD
Looking at Graph 2 and considering its time frame, this program seems to be linked to economic growth. However, it is difficult to establish causation, as QE coincides with the recovery from the sovereign debt crisis, which by itself should have a positive impact on GDP. However, when it comes to inflation, success is yet to be a reality. This can be a result of two factors. On the one hand, the liquidity trap environment (interest rates close to 0% since 2009 and lately even lower) makes monetary policy less effective – the ECB cannot drop interest rates much further to stimulate the economy. On the other hand, uncertainty – which has risen to another level with the pandemic – leads to higher investment/savings rather than greater consumption – instead of reaching the real economy, inflation is deviated to financial markets, as it will be further developed in the next section.
Monetary policy by the ECB and the Fed during the pandemic and how it has been impacting economic recovery
The COVID-19 economic shock is one of the biggest since the Great Depression of the 1930s (Graph 4). It is particularly meaningful in the sense that the world as a whole – and not just some economies, as during the financial crisis of 2008-2009, for instance – has been heavily impacted. Supply-related disruptions and a substantial fall in demand led governments across the globe to design never-before-witnessed stimulus packages. At the same time, central banks have been engaging in an even more expansionary policy, reflected in their financials (Graph 4).
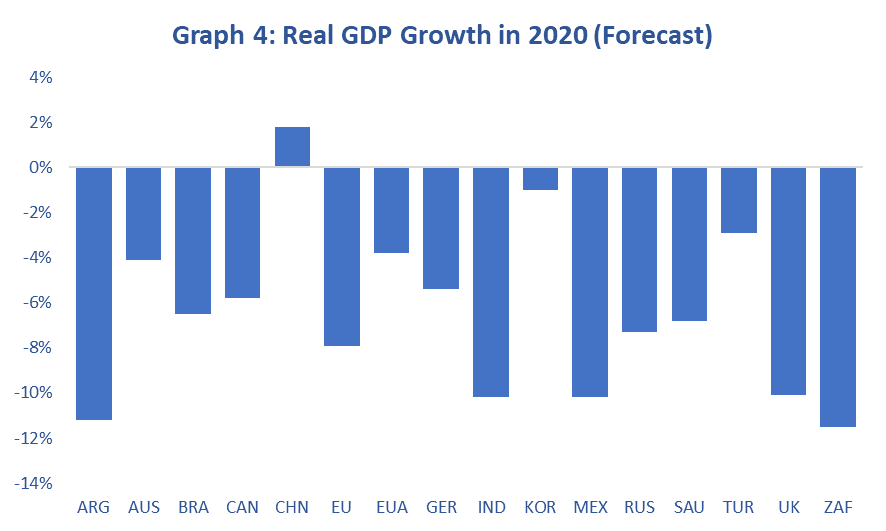
Data sources: European Central Bank, Federal Reserve Board
In the words of the former ECB’s President Mario Draghi, both the ECB and the Fed have been doing “whatever it takes” to help the European and American economies during such hard times. On the one hand, the ECB, besides loosening reserve requirements and setting lower interest rates, has launched its Pandemic Emergency Purchase Program (PEPP) (similar to QE), amounting to 1.35 trillion euros in the purchase of assets, just since March 2020. On the other hand, the Fed has also been undertaking a massive asset purchasing program, alongside direct support to mutual funds, banks, corporations and state and local governments.
The main problem stemming from monetary policy during these past few months is that, as briefly mentioned in the last section, it has not been particularly efficient in addressing supply and demand issues, since the high level of uncertainty channels funds to financial markets instead of the real economy. Especially in the US, this has induced an extreme asset overvaluation – the American stock market is worth, as of September 17, 2020, more than 175% of the US GNP (Graph 5).

Graph 5: Buffet Indicator
Source: GuruFocus
More evidence on the ineffectiveness of monetary policy in facing the wreak havoc by the pandemic is provided by the relationship between money stock and money velocity – despite the quantity of money has soared, the velocity at which it circulates struggles to increase, reflecting very low economic activity (Graph 6).
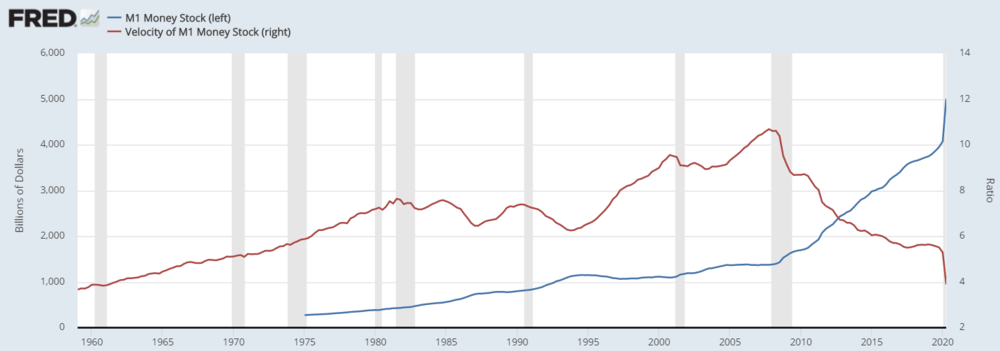
Graph 6: Money stock versus money velocity (US)
Source: Federal Reserve Economic Data
What lies ahead?
Monetary policy has faced complex challenges throughout time. Nowadays, policymakers are being forced once again to think outside the box, which has resulted in the non-standard measures discussed above. For now, policy transmission seems to be struggling, which may lead central banks to increase their stimuli, but maybe this is the time to focus on increasing efficiency rather than on pure money printing.
Sources: Corporate Finance Institute, European Central Bank, Federal Reserve Board, Federal Reserve Economic Data, GuruFocus, Investopedia, OECD, SpringerLink, The Brookings Institution, World Bank
