The End of the Unipolar World: Is A New Global Order Taking Shape?

Is the world entering a multipolarity era?

For roughly three decades following the collapse of the Soviet Union in 1991, the United States stood as the world’s unchallenged superpower. Political scientist Charles Krauthammer famously described this era as the “Unipolar Moment”, a period in which no other nation could rival American military, economic, or diplomatic reach. Today, that moment appears to be ending.

A convergence of forces (e.g., the economic ascent of China, the expansion of the BRICS bloc, shifting US foreign policy, and the growing assertiveness of the Global South) is reshaping the international order at a pace that few anticipated.

The Architecture of American Dominance

To understand what is changing, it is necessary to understand what it once was.

After the Cold War, the United States accounted for roughly 25% of global GDP, operated the world’s most powerful military by a significant margin, and anchored a network of international institutions (think of the United Nations, the World Trade Organization, and the International Monetary Fund) that largely reflected Western values and priorities. The US dollar became the world’s dominant reserve currency, giving Washington extraordinary leverage over the global financial system.

This period of unipolarity was not simply a matter of military might: it was a comprehensive structural dominance spanning economics, technology, culture, and governance.

The Rise of New Powers

That architecture is now under sustained pressure.

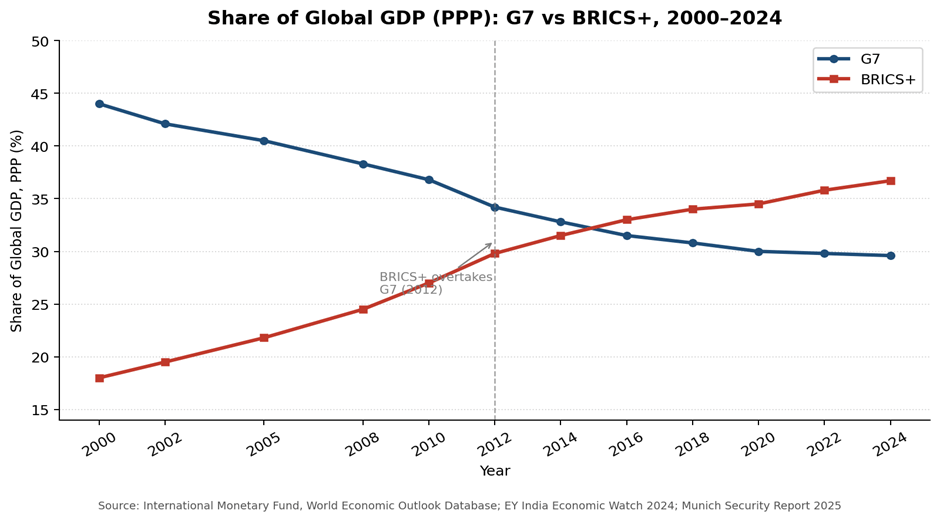
The most significant challenge comes from China, whose economy has grown from approximately $1.2 trillion in 2000 to over $18 trillion today, a rise from 4% to nearly 18% of global GDP. Simultaneously, the BRICS bloc (originally comprising Brazil, Russia, India, China, and South Africa) has expanded aggressively, and as of 2026 represents over 36% of global GDP measured in purchasing power parity (PPP), already surpassing the G7’s share of roughly 29.6%, according to IMF data.

This is not merely an economic story. The BRICS nations collectively account for approximately 40% of global trade, according to the Munich Security Report 2025, whose central theme was precisely “Multipolarization”. The report observed that an ongoing power shift toward a greater number of states vying for influence is clearly discernible, marking a decisive shift in the language of mainstream international security analysis. Beyond BRICS, middle powers including Turkey, Saudi Arabia, India, Indonesia, and Brazil are increasingly acting as independent actors rather than automatic supporters of the Western-led order. At the 2025 Munich Security Conference, 30% of speakers represented the Global South, a figure that would have been unthinkable a decade ago.

Figure 1. Share of Global GDP (PPP): G7 vs BRICS+, 2000–2024

Fracturing Alliances and US Foreign Policy

The second major driver of change is the United States itself.

The return of Donald Trump to the White House in January 2025 accelerated tensions already present within the Western alliance system.

Trump’s approach, characterized by tariff escalation, skepticism toward NATO burden-sharing, and unilateral diplomatic maneuvering, strained relations with traditional partners in Europe and Asia. Europe, long dependent on US security guarantees, responded by dramatically increasing defense spending, though analysts note it will remain reliant on American military infrastructure for years to come.

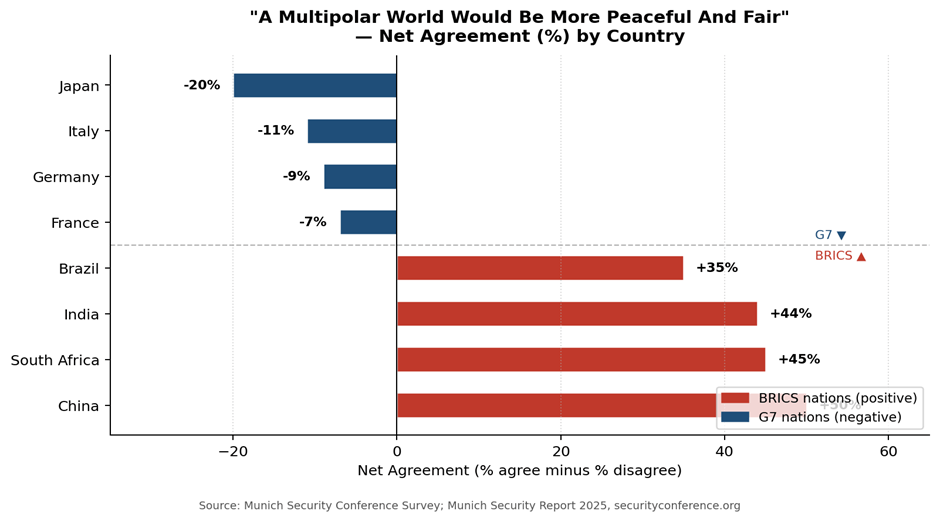
At the same time, a growing divergence is visible in how different parts of the world perceive the emerging order. Surveys conducted for the Munich Security Report 2025 found that majorities in G7 nations view the shift toward multipolarity with concern, fearing increased disorder and conflict. By contrast, large majorities in China (+50% net agreement), South Africa (+45%), India (+44%), and Brazil (+35%) believe a multipolar world would better address the needs of developing nations. The North-South divide has rarely been so sharply quantified.

Figure 2. “A Multipolar World Would Be More Peaceful and Fair”, Net Agreement (%) by Country.

The Dollar, The Military, And the Limits of Decline

The narrative of American decline is, however, contested by several analysts. Writing in Foreign Affairs in February 2026, analyst C. Raja Mohan argued that “the first year of Trump’s second term has punctured the narrative of American decline and the rise of multipolarity,” pointing to the US ability to intervene militarily, reshape trade rules, and push resolutions through the UN Security Council with limited effective resistance.

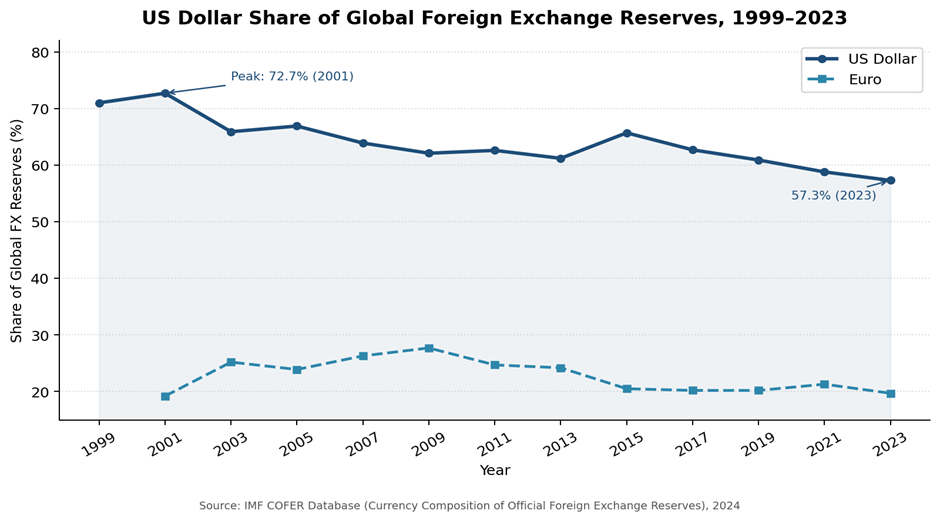
A key pillar of this argument is financial. The US dollar still accounts for approximately 57% of global foreign exchange reserves, according to IMF COFER data, down from a peak of nearly 73% in 2001, but still far ahead of any rival currency. The euro, its closest competitor, holds under 20%. Efforts by BRICS nations to launch an alternative reserve currency or payment system have so far failed to gain traction, with even the BRICS Development Bank continuing to operate primarily in US dollars. Beyond finance, the US continues to dominate the sectors most critical to 21st-century power: artificial intelligence, semiconductor technology, and advanced military systems. Russia, often cited as a pillar of a new multipolar order, has a GDP smaller than that of Italy and a narrow economic base heavily dependent on natural resource exports.

As the Munich Security Report 2025 concluded with notable precision: “Today’s international system shows elements of unipolarity, bipolarity, multipolarity, and nonpolarity. What you see depends on where you look.”

Figure 3. US Dollar Share of Global Foreign Exchange Reserves, 1999–2023

What Multipolarity Would Mean in Practice

Regardless of how the academic debate is resolved, the practical consequences of the current transition are already visible. Multilateral institutions are under strain: the WTO’s dispute resolution mechanism remains largely paralyzed, the UN Security Council is increasingly deadlocked, and global supply chains are fragmenting along geopolitical lines, a process known as “friend-shoring”, as nations prioritize strategic alignment over economic efficiency.

Some analysts see opportunity in this transition. Chatham House researcher Amitav Acharya has argued that a “multiplex” world order could emerge, one characterized by greater ideological diversity, more inclusive global institutions, and stronger regional governance. The inclusion of the African Union in the G20 in 2023 was cited as a potential sign of this more representative direction. The Munich Security Report 2025 cautioned, however, that without shared rules, multipolarization risks producing not a fairer world but a more conflictual one:

“Before our eyes, we are seeing the negative scenario of a more multipolar world materialize — a more conflictual world without shared rules and effective multilateral cooperation.”

Conclusion

The world of 2026 is no longer the world of 1995. While the United States retains unmatched military capability and continues to anchor the global financial system, its ability to set the terms of international order unilaterally has measurably diminished.

The rise of China and the BRICS bloc, combined with a more assertive Global South and an increasingly transactional US foreign policy, are producing a structural transition whose ultimate destination remains unclear. What is certain is that the rules, institutions, and alliances that defined the post-Cold War era are under revision and the outcome of that revision will shape the next several decades of global politics.

Sources

Munich Security Conference, Munich Security Report 2025 C. Raja Mohan, “The Multipolar Delusion,” Foreign Affairs, February 2026 ; Brandon J. Weichert, “The Unipolar Moment Is Over,” The National Interest, December 2025 (nationalinterest.org); Amitav Acharya, “The Decline of the West and the Rise of the Rest,” The World Today, Chatham House, December 2025 (chathamhouse.org); Centre for International Governance Innovation, “America’s Unipolar Moment Is Over” (cigionline.org); MD. Abir Mahmud Jakaria, “Global Power Shift: Is the United States Losing Dominance in the Emerging Multipolar World Order?” ResearchGate, February 2026 (researchgate.net); Indian Journal of Law and Legal Research, “The Rise of Multipolarity: Is the Unipolar World Order Officially Over?” February 2026 (ijllr.com); IMF, World Economic Outlook Database (imf.org); IMF, COFER Database — Currency Composition of Official Foreign Exchange Reserves (imf.org); EY India Economic Watch, “Can BRICS Play a Key Role in Shaping Future Global Economic Policy?” 2024 (ey.com); BRICS Brazil Presidency, “BRICS GDP Outperforms Global Average”

Rebecca Fratello 

Writer

Why Property Matters More Than Income 

For a long time, inequality was mostly discussed in terms of income, jobs, and education. But in many rich countries today, the real difference is often about who owns property. Two households can earn similar salaries and still have very different futures if one owns a home and the other rents. Housing is no longer just a place to live. It is one of the main ways families build wealth, gain financial security, and pass advantages on to their children. Across OECD countries, wealth is much more unevenly distributed than income, the richest 10% of households own more than half of total household wealth on average, while the bottom half owns very little. 

Asset Inequality 

Income shapes what a household can afford today. Wealth shapes what it can survive, invest, and pass on tomorrow. This matters because wealth gives protection against unemployment, illness, rising prices, and economic shocks in a way that income alone often cannot. A household with a modest salary but a fully paid home may be much more secure than a household with the same salary, no assets, and high rent. Research on OECD shows that wealth inequality is greater than income inequality, and that housing makes up a large part of household wealth, especially for people outside the extremely richest groups. 

Housing is important because it is both something people need and something that can make them wealthier. Everyone needs a place to live, but people who own a home can slowly build value with it, benefit if house prices go up, and sometimes use it to borrow money. This gives housing a big effect on people’s financial security and future opportunities. That is why housing does not just show inequality but can also make it worse. 

Homeownership Creates Advantage 

Owning a home creates advantages in several ways. First, mortgage payments can gradually turn monthly housing costs into ownership. Rent, by contrast, pays for shelter but does not create an asset. Second, homeowners may benefit if the value of their property rises over time. Third, owning a home often brings more stability, since owners are usually less exposed to sudden rent increases or be forced to leave their home. Finally, housing wealth can later help pay for education, retirement, or children’s future home purchases. 

This means the gap between owners and renters increasingly looks like a class divide. Owners can build wealth while meeting a basic need. Renters usually cannot. Over time, that difference grows. A family that buys early may spend years building equity. A family that rents for the same period may face rising housing costs without gaining any asset in return. In this way, housing turns inequality from a matter of monthly income into a matter of long-term ownership. 

Why Buying A Home Is Getting Harder 

This would matter less if everyone had a fair chance to buy a home. But entering the housing market has become more difficult, especially for young people. House prices have risen sharply in many places. Down payments are harder to save for. Credit rules are often stricter. And high rents make saving even harder. Eurostat data shows that in some EU countries, young people spend a very large share of their income on housing.  

This matters because high rent does not only create pressure in the present, but it also reduces the ability to save for the future. The result is a cycle, those who already own homes benefit when prices rise and those who do not own face a higher barrier to entry every year. In this sense, the housing market often rewards those who are already inside it while making it harder for outsiders to enter. 

Figure 2 – Housing cost overburden by age group 

Inherited Wealth 

This is where the issue becomes generational. When homes become so expensive that wages alone are not enough to buy one, family wealth starts to matter much more. Parents may help with a down payment, give property directly, or leave an inheritance that makes homeownership possible. In that kind of system, access to property depends less on current income and more on whether someone’s family already owns assets. 

OECD evidence suggests this is not a small issue. In several European countries, a significant share of low-income homeowners got their homes through inheritance or gifts rather than through purchase alone. OECD research on inheritance also shows that wealth transfers tend to increase inequality, because the people who receive inheritance are often already better off.  

This does not mean income no longer matters. Salaries still affect daily life, access to credit, and the ability to pay a mortgage but income alone matters less when wealth already gives some people a head start. A good salary helps, but it may still not be enough to buy a home without family support. At the same time, a household with inherited property may enjoy more security and wealth growth than a renter with a higher income.  

The Political and Social Effects 

When property matters more than income, the effects go beyond money. Homeownership can shape access to better neighborhoods, better schools, more stability, and greater security in old age. It also affects politics. Existing homeowners often benefit from rising house prices and may oppose reforms that would lower them, even if those reforms would help younger or poorer households. 

This helps explain why housing policy is so difficult. Building more homes, changing zoning laws, expanding social housing, or taxing property more effectively could improve access for people outside the market. But these policies may conflict with the interests of people who already own property. As the World Bank has noted, housing affordability is not only a social issue, but it can also reduce labor mobility and stop young people from moving to places where the best jobs are. 

Figure 3 – OECD countries have ample room to shift the tax burden towards property taxes 

Conclusion 

The class division today is not just between people with high salaries and people with low salaries. More often, it is between people who own property and people who do not. Housing is the clearest example, because owning a home can give families more than shelter, it can give them wealth, stability, and something to pass on to their children. As buying a home becomes harder, and more dependent on family support, inequality becomes more deeply rooted across generations. If this trend continues, what matters most may not be who earns the most, but who already owns something valuable. 

Sources:

Margarida Ferreira

Writer

M-pesa: How Mobile Money Transformed Financial Inclusion and Redefined Development Finance 

A Cash Economy Meets a Mobile Network

In 2007, M-Pesa was launched by Kenya, soon to become one of the most influential financial innovations in development economics. The platform was developed by Safaricom with support from Vodafone, with the aim of allowing users to send and receive money through basic mobile phones. A simple payment solution at first glance, but life changing at its roots.

Before M-Pesa, most Kenyans were under a cash-dominated and largely informal economy: bank branches concentrated in urban centres, restrictive documentation requirements, and minimum balance conditions excluding low-income households. For rural families, sending money often meant physically transporting cash or relying on informal couriers, both costly and risky.

M-Pesa was an alternative to this. Using SMS-based USSD technology, no traditional bank account was needed. Users could use basic mobile phones without internet connectivity, being able to deposit cash with local agents, store value electronically, and transfer funds instantly. In other words, it wasn’t a simple payment application, but a new layer of digital financial infrastructure.

Financial Inclusion as a Driver of Development

Financial inclusion has been theoretically and empirically demonstrated to be a catalyst for economic growth. By granting access to savings mechanisms, credit, and secure payment systems, households can smooth consumption, invest in education and healthcare, and manage economic risk. In other words, households are opened doors towards productivity and resilience.

The traditional way in which Kenyans would manage their money was highly inefficient and vulnerable to theft or loss. But with M-Pesa, financial access started moving from informal networks to formal digital systems.

Financial Inclusion Measured by Access in Kenya (2006–2021).

Informal reliance and outright exclusion dropped, and as shown by data, digital finance brought millions of people into the formal system.

With M-Pesa, sending money became instantaneous and significantly safer. Migrant workers in urban centres could transfer funds to relatives in rural areas without intermediaries. According to research by Tavneet Suri and William Jack, access to M-Pesa lifted around 2% of Kenyan households out of extreme poverty between 2008 and 2014.

However, aggregate expansion tells only part of the story. The distribution of access across gender reveals a deeper transformation.

Share of Male and Female Adults (18+) Who Are Financially Included, 2006–2024.

The financial inclusion gender gap, which exceeded 12 percentage points in 2006, narrowed dramatically over time. For instance, M-Pesa’s impact was particularly determining for women. After obtaining access to mobile financial services, many of them evolved from subsistence agriculture to small-scale retail and entrepreneurial activities. Barriers to entry were reduced, hence expanding economic agency and participation across previously excluded groups.

These trends speak loudly. When remittances become reliable and affordable, labour mobility increases, local businesses gain liquidity, and households become more resilient to shocks. A true structural economic change. Digital financial infrastructure can therefore function as a quasi-public good, even when delivered by a private company.

Fintech Innovation in a Low-Income Context

Clearly, M-Pesa emerged from a developing economy responding to local constraints, definitely not a high-income technology. Hence, the system was designed for simplicity and scalability. USSD technology allowed even the most basic phones to participate in the digital economy.

From a fintech perspective, M-Pesa demonstrates the power of platform-based financial ecosystems. Over time, the service expanded beyond peer-to-peer transfers to include bill payments, salary disbursement, merchant services, savings accounts such as M-Shwari, and microcredit products. Hence, as other fintech cases, the platform soon evolved into an integrated financial ecosystem operating hand in hand with traditional banks.

This trajectory challenges classical assumptions in financial development theory. Conventional models often suggest that financial deepening requires the gradual expansion of banking institutions, physical branches, and formal credit markets. Kenya experienced a form of technological “leapfrogging,” bypassing intermediate stages by leveraging widespread mobile penetration to accelerate financial integration.

Such a leapfrogging effect has inspired similar systems across Sub-Saharan Africa and parts of Asia, including Tanzania, Ghana, and Bangladesh. In several African economies, mobile money accounts now outnumber traditional bank accounts. However, adoption rates remain uneven across the continent, reflecting differences in infrastructure, regulation, and market structure.

The Potential of Mobile Payment in Africa.

In particular, Kenya’s position within the African digital payments landscape shows both the scale of its transformation and the broader potential of mobile finance.

Macroeconomic And Structural Impacts

M-Pesa’s influence goes much beyond household-level outcomes. Over the past decade, both the volume and total value of mobile money transactions have increased exponentially, signalling the system’s growing macroeconomic significance.

Volume and Value of Mobile Money Transactions in Kenya (2008–2018).

The Central Bank of Kenya reports that mobile transactions now account for a substantial share of national GDP.

Moreover, digital transaction histories provide valuable data. Typically, in development economics, information asymmetry (where lenders lack reliable information about borrowers) constraints credit markets. But by creating digital financial records, mobile money platforms mitigate such a barrier. Thus, M-Pesa contributes to the formalisation of informal economic activity, increasingly including small-scale entrepreneurs into broader financial networks.

However, rapid expansion introduces regulatory complexities. Safaricom’s dominant position in the Kenyan market has raised concerns regarding competition and interoperability. It’s essential that policymakers balance innovation with financial stability, consumer protection, and data privacy safeguards. Digital infrastructure can promote inclusion, but it also concentrates power if regulatory frameworks do not evolve accordingly.

Challenges And Future Prospects

M-Pesa’s success has transformed it from a financial innovation into a pillar of Kenya’s economic infrastructure. With that scale comes new complexity. As mobile money underpins remittances, small businesses, and even public transfers, digital platforms increasingly carry systemic importance. Operational failures, cybersecurity risks, or governance weaknesses would now have economy-wide consequences.

Market concentration and data governance present additional challenges. Safaricom’s dominance strengthens network efficiency, yet it raises concerns about competition and interoperability. At the same time, vast volumes of transactional data improve credit access but intensify debates over privacy, surveillance, and algorithmic fairness. Financial inclusion must therefore evolve alongside regulatory capacity.

The broader lesson is that inclusion is not static. As fintech ecosystems become more sophisticated, digital literacy gaps and unequal access to technology risk creating new forms of exclusion. M-Pesa’s future will depend not only on technological expansion, but on institutional design, ensuring that innovation remains inclusive, competitive, and resilient.

In this sense, the Kenyan experience does not mark the end of a development story, but the beginning of a new policy frontier: how to govern digital finance as a public economic utility.

Sources: World Bank Global Findex Database; Central Bank of Kenya Annual Reports; Suri, T. & Jack, W. (2016), The Long-Run Poverty and Gender Impacts of Mobile Money, Science; GSMA State of the Industry Report on Mobile Money; Safaricom Annual Reports; MIT News; Financial Times; United Nations Development Programme.

Rebecca Fratello 

Writer

Orbit Under Siege: The Economic Cost Of Space Militarization 

Global Infrastructure At Risk 

We rarely think about it, but the modern economy is tethered to the stars. The invisible signals from Global Positioning System (GPS) satellites do far more than guide your Uber. They provide the precise timing stamps that synchronize stock market trades, manage power grids, and authenticate banking transactions. 

This creates a terrifying fragility. If a conflict on Earth spills into space, it wouldn’t just be a military problem; it would be an economic cardiac arrest. Experts have long warned that attacking satellites is a double-edged sword because everyone, aggressor and defender alike, relies on the same physics to navigate, forecast weather, and communicate. We saw a preview of this chaos during the Russia-Ukraine war, where GPS jamming disrupted civilian flights and shipping across Europe. The reality is simple: the more we treat orbit as a battlefield, the more we risk the invisible infrastructure that keeps the world running. 

The Booming Market For Space Defense 

Space is no longer just a frontier for science; it is a massive market for defense capital. In the last five years, global military spending on space has doubled, hitting $60 billion in 2024

The forecast is clear: this is just the beginning. Analysts project the sector will grow to over $63 billion in 2026 and cross $83 billion by 2030

Forecasted growth of the global space militarization market from 2020 to 2030, based on recent projections.

This isn’t just about nations buying more hardware; it’s about fear. The United States Space Force alone requested nearly $40 billion for 2026, a 30% jump in a single year. But if you look closely at where that money is going, you’ll see a shift. Governments aren’t just building weapons to blow things up; they are desperately spending money to figure out how to keep their own lights on. 

The Shift To ‘Soft’ Warfare 

Military strategy in space is undergoing a quiet revolution known as “softwarization.” 

The logic is pragmatic. If you blow up a satellite with a missile (“hard kill”), you create a cloud of debris that could destroy your own satellites days later. It’s the orbital equivalent of setting off a grenade in a small room. Instead, nations are pivoting to “soft kill” tactics: jamming signals, blinding sensors with lasers, or hacking software. These methods can disable an enemy without turning low-Earth orbit into a graveyard. 

Investment is increasingly focused on enhancing resilience. For example, new GPS satellites are being deployed with military-grade encryption (M-code) to better withstand jamming. Furthermore, satellites are now being designed with artificial intelligence to enable “self-healing” or the ability to reroute data automatically if a component is attacked. This trend has been described by one general as a “race to resilience.” 

Debris: The Hidden Tax On Orbit 

The biggest threat to the space economy isn’t a laser; it’s junk. Decades of launches and reckless anti-satellite tests have left Low Earth Orbit (LEO) cluttered with shrapnel. 

Today, surveillance networks track about 35,000 objects in orbit. Here is the scary part: only about 9,000 are active satellites. The rest, over 26,000 pieces, is lethal garbage traveling at 17,000 miles per hour. 

Number of tracked objects in Earth orbit over time. 

This creates a literal “congestion tax” for businesses. Satellite operators now have to burn precious fuel dodging debris, which shortens the satellite’s life and kills profit margins. Insurers are panicking, too, hiking premiums by 5–10% for missions in crowded orbits. 

The nightmare scenario is the Kessler Syndrome: a chain reaction where one collision creates debris that causes two more collisions, eventually turning orbit into an unusable wasteland. 

The chain reaction referred to as the Kessler Syndrome. 

With China (2007) and Russia (2021) having already conducted tests that spewed thousands of fragments into space, the environmental cost of this “war” is already being paid by every commercial operator. 

The Geopolitical Chessboard 

Every major power is playing a different game: 

  • United States: The U.S. is betting on “safety in numbers.” Instead of relying on a few giant, vulnerable satellites (“Battlestar Galacticas”), the Space Force is launching swarms of smaller, cheaper satellites. If an enemy shoots one down, the network survives. 
  • China: Beijing sees space as the ultimate high ground. Since its 2007 anti-satellite test, China has built an arsenal of lasers and jammers while launching its own BeiDou navigation system to ensure it doesn’t need American GPS in a fight. 
  • Russia: Lacking the budget to match the U.S. dollar-for-dollar, Russia plays the role of the spoiler. It focuses on asymmetric threats, jamming signals (as seen in Ukraine) and threatening to target commercial satellites that help its enemies. 
  • Europe: Europe has woken up. Realizing it relies too heavily on others, the EU launched a “Space Strategy for Security and Defence” in 2023. They are building secure communication networks (IRIS²) and a “European Space Shield” to protect their assets. 

Private Companies On The Frontline 

Perhaps the biggest change is who is involved. In the past, space war was for governments. Today, private companies like SpaceX (Starlink) and Maxar are on the front lines, providing communications and intelligence in active war zones like Ukraine. 

The most mentioned organisations in online media in the context of space debris, as determined by AMPLYFi’s analysis. 

This blurs the line dangerously. If a private satellite is helping an army, is it a legitimate military target? As corporations launch tens of thousands of new satellites, they aren’t just bystanders; they are active participants in a congested, contested domain. 

Conclusion 

Earth’s orbit is no longer a peaceful void. It is a busy, dangerous, and incredibly expensive industrial zone. The rush to militarize space risks destroying the very “commons” that our modern economy stands on. The next decade will decide whether we can manage this tension, or if we are hurtling toward a future where the skies above us are permanently closed for business. 

Sources: Fortune Business Insights; Research and Markets; Payload Space; World Economic Forum (WEF); U.S. Space Force Financial Management; SatNews; NOAA Space Weather Prediction Center. 

Rebecca Fratello 

Writer

Is There An AI Bubble: A Structural Analysis 

As we conclude 2025, the debate around the “AI bubble” has clearly shifted from a mere discussion of technological potential to a worried interrogation of financial sustainability. After three years of persistent AI investments following ChatGPT’s launch, the sector is now going through slowing growth expectations, skyrocketed capital costs, and doubts around future profitability. 

Whether to the upside or downside, AI currently is and will be the main driver of the returns in the public equity market. But to allocate capital in the market, investors must feel confident that what is going on is not indeed a bubble burst.  

What Defines a Bubble 

A financial bubble happens when asset prices are substantially higher than their fundamental values. Investors go long (buy) when they believe an asset is undervalued, meaning it is priced under its fair price. But as prices keep rising, investors’ motivation changes, with the focus shifting from how much the asset is valued towards how much higher it can still go.  

To determine whether the current AI cycle represents a true financial bubble, we can evaluate it against the phases defined by Charles Kindleberger and Hynan Minsky. 

Displacement 

 
Everything starts from an innovation that fundamentally changes the perceived profit opportunities in a major sector. The launch of ChatGPT in late 2022 acted as the catalyst triggering a regime where technology was not simply considered a tool anymore, but rather a “New Era” of boundless productivity.  

Nasdaq-100 market value growth. 

Over the last 5 years, NASDAQ-100 has delivered a total return of approximately 120.6%, representing a compound annual growth rate of 17.1%. An initial growth was driven by the post-pandemic digital shift, but the true catalyst was indeed the launch of ChatGPT. 

Boom and Euphoria 

Stability in this phase is officially destabilized. The sustained performance of AI leaders has been increasingly convincing lenders and regulators that the system was safe, leading to a weakening of credit discipline.  

By 2025, the most profitable four technology companies at the global level are borrowing at rates that we haven’t seen so far since the telecom bubble to build infrastructure for demand that potentially may never arrive.  

Only in 2025, Amazon, Google, Microsoft, and Meta invested over $400 billion on AI infrastructure, with current expectations according to Man Group of even $3 trillion over the next five years. Bain & Company estimated that to justify such CAPEX, such companies should generate $2 trillion in new AI revenue by 2030, literally a 100x increase from the current $20 billion baseline.    

For example, since 2022, US investment has shifted away from typical office construction towards data centres, reflecting the rapid expansion in AI-driven infrastructure. 

US spending: Office construction vs. Data centre infrastructure

One of the biggest concerns about this is the change in strategy it deep down represents. The value of Big Tech was typically based on the ability to generate quick revenue growth at low costs, resulting in great free cash flows. However, their AI choices have now turned this model upside down. 

This level of investment is extraordinary. At its peak, the 5G telecom buildout deployed about 70% of operating cash flows. AI infrastructure is going in the same direction. Hyperscalers are trying to power their own workloads, while AI developers are trying to train large language models (LLMs). Hence, big tech stocks have risen, but if computing supply is limited by insufficient power, then the AI bubble could deflate.  

This bubble is indeed concentrated in such Magnificent Seven, which drive much of the S&P 500’s daily price moves. If their valuations fall, several portfolios will take a hint, even for people who think they are merely passively saving for retirement. 

Panic 

Analysts are keeping under control the Minsky Moment, that is the point where the system turns into a Ponzi scheme.  A Ponzi scheme can be thought of as a scam scheme that promises a high return with little risk to new investors, relying on the word-of-mouth spreading about the big returns earned by early investors. Ultimately, if the flow of new investments slows down, it becomes impossible to pay out those supposed profits. That is when the Ponzi scheme collapses.  

At this stage, borrowers cannot afford the repayment of their debt from current operations and must completely rely on rising asset prices to meet their obligations.  

If we look at the 2025 AI cycle, signs of a Minsky Moment include: 

  • Accounting Illusions: The systemic extension of GPU depreciation schedules from 3-4 years to 6 years, which potentially masks a $176 billion earnings impairment “time bomb”. 
  • Credit Signals: Rising costs in Credit Default Swaps (CDS) for firms like Oracle (which hit a record 1.26% spread) suggest that lenders are beginning to reassess the risk of CapEx-heavy balance sheets.    
  • The Funding Gap: A projected $1.5 trillion shortfall in the capital needed for data center buildouts between 2025 and 2028, forcing a dangerous reliance on private credit and high-yield debt to keep the cycle alive. 

This suggests that a “Panic” or “Profit-taking” phase could be triggered once a critical mass of investors realises that the forecasted 100x revenue growth will not materialise within the 2-3 year lifespan of the current hardware. 

Nvidia As Barometer 
 
Many look at Nvidia as the current market’s most reliable signal for whether the AI boom is grounded on reality or a fable of excess. We are talking about the main supplier of chips powering LLMs and data centres, hence its revenues are said to reflect actual AI spending. In other words, it is the heart of the AI infrastructure.  
 
The stock has indeed become a proxy for the health of the overall AI ecosystem. When Nvidia’s stock price surges, it supports the confidence that AI is a productive investment, but when it falls, it creates doubts about whether capital is invested faster than what revenues justify.  
 
No other company has benefited from AI spending than Nvidia. The stock, indeed, has surged alongside unprecedented GPU orders from cloud providers.  

Nvidia 5-years stock market price.

Key here is the chosen depreciation policy. Tech giants have lengthened their server lifespans on the books to six years. However, Nvidia’s products are made to be changed every year, making older chips obsolete and less energy-efficient.  

For Nvidia, the next steps will rely on execution rather than hype. Markets are already watching closely to see whether hyperscalers will keep their capex as depreciation costs increase, whether demand will expand beyond a few dominant players, and whether AI revenue growth can cover the scale of infrastructure investments.  

Big Tech Depreciation expenses growth. 

In particular, rising depreciation costs are pressuring buybacks and dividends, that is return for stockholders. In 2026, major actors as Meta and Microsoft are even expected to have negative free cash flows after accounting for shareholder returns.  
 

If Nvidia will maintain a positive performance against those questions, it may actually fade bubble fears. Otherwise, its share price will reflect a market that changes expectations. 

Conclusion 

If on one hand fears of an upcoming bubble may be premature, the era of unquestioned enthusiasm is fading away in front of our eyes. Most analysts are not expecting a dramatic collapse as with the dot-com bust. Nowadays AI leaders are far bigger, more profitable, and better capitalised than their late ‘90s counterparts. According to experts, what might actually happen, instead, is a change within the AI trade, with investors favouring companies that have clear cash flow generations and scalability, against historically expensively valued names relying on flawless execution. 

Sources:

Financial Times; Investopedia; Yahoo Finance; Bloomberg; Bain & Company; Business Insider; BBC; CNBC. 

Rebecca Fratello 

Writer

Trapped In Choice: How More Choices Make Us Less Happy 

We live in an era of extraordinary abundance. At any moment, people are exposed to far more alternatives than previous generations did, across nearly every domain in life. The world has never offered so much choice, yet many individuals feel increasingly overwhelmed by it. 

Psychological research suggests that, while choice is essential for autonomy and well-being, too many options can have the opposite effect on decision-making quality and satisfaction. This phenomenon challenges the assumption of classical economics that more alternatives lead to better outcomes. 

The psychology of choice overload 

When confronted with a large number of alternatives, individuals often experience difficulty in making decisions, a tendency known in literature as choice overload or overchoice.  

One of the earliest and most cited demonstrations of this effect was the so-called “jam experiment” conducted by psychologists Sheena Iyengar and Mark Lepper. In their study, shoppers at a local market were presented with either 24 varieties of jam or just 6, and while more customers stopped at the larger display, far fewer made a purchase compared to those who saw fewer options.  

This counterintuitive result highlights a central paradox: abundance of choice can reduce the likelihood of a decision being made at all. The cognitive load associated with evaluating too many alternatives can lead to what psychologists identifiy as decision paralysis, where individuals delay or avoid making any choice due to overwhelming complexity.  

In this context, research points to additional consequences of choice overload, including increased stress, regret for forgone options, and lower confidence in the choices that are made.  

Figure 1: Illustration of the “jam experiment” showing how larger assortments attract more shoppers but lead to lower purchase rates compared to smaller assortments. Source: Your Marketing Rules 

The cognitive cost of choice overload  

From a neuroscientific perspective, decision-making consumes cognitive resources. In particular, the prefrontal cortex, often described as the brain’s executive center for planning and evaluation, plays a significant role in choosing among alternatives. As the complexity of options increases, so does the mental effort required to process information and make judgments, defined as cognitive load. When faced with an excessive number of alternatives, this increased load can exceed working memory capacity, leading to mental fatigue and suboptimal choices.  

In extreme cases, prolonged decision-making under such conditions can trigger what psychologists term decision fatigue, a decline in decision quality that arises after repeated cognitive exertion during choice tasks.  Importantly, decision fatigue often results in a shift toward simpler heuristics or impulsive reactions based on biases, rather than thoughtful deliberation.  

How the digital era multiplies our choices 

In the digital era, choice overload permeates everyday life: a typical online marketplace now offers thousands of products, each often presenting mulitple ratings, features, and reviews. Streaming services aggregate tens of thousands of titles, and users often report spending more time choosing what to watch than actually watching.  

Figure 2: Number of TV programs produced in the U.S. from 1950 to 2022, showing accelerated growth in the digital age. Source: IMDB

Even outside market-based decision environments, people face an ever-expanding range of alternatives in careers, travel destinations, social interactions, and financial decisions. Behavioral economists and psychologists note that this proliferation of options can paradoxically diminish overall satisfaction and confidence in one’s choices. This trend also shapes broader macroeconomic dynamics. When choices become overwhelming, people participate less actively in markets, often stepping back from decisions altogether. Evidence from e-commerce illustrates that when faced with an excess of product options, many consumers simply postpone or abandon their purchases. 

Figure 3: Proportion of subjects who bought any pens as a function of the number of choices available. Source: Ness Labs 

The human cost of abundance 

Although choice is often associated with autonomy and freedom, an excess of options may lead to psychological downsides. One well-studied distinction in literature differentiates between “maximizers”, individuals who seek the best possible option, and “satisficers”, those who settle for good enough. When faced with abundant choices, maximizers tend to experience higher levels of regret, lower satisfaction, and greater decision anxiety than satisficers.  

Further research suggests that an abundance of choice can even undermine self-control and promote impulsive behavior, particularly after making repeated decisions. This effect has been documented in studies showing that frequent decision-making can deplete mental resources, leading to cognitive and emotional fatigue.  

Beyond individual psychology, widespread choice overload may contribute to broader societal patterns of stress and dissatisfaction. Rather than eliciting joy, the freedom to choose can inflate expectations and intensify regret, particularly when people believe a better choice was possible.  

Toward smarter choices 

Despite its potential drawbacks, choice is still a fundamental part of our lives and need not be feared. A growing body of research indicates that individuals can navigate abundant options more effectively through strategic decision frameworks and environmental design. For example, consciously limiting the number of alternatives under consideration, a practice known as pre-filtering, has been shown to streamline decision-making and reduce cognitive strain. Other helpful approaches include setting clear criteria before engaging in selection, focusing on satisficing rather than maximizing when faced with many options, and using structured heuristics that prioritize key attributes over exhaustive comparison.  

Behavioral economists refer to these techniques collectively as part of choice architecture, which aims to structure decision environments in ways that support better outcomes without eliminating freedom of choice.  

Conclusion 

The paradox of choice illustrates a key tension in modern life: while freedom and autonomy are deeply valued, an excess of options can undermine the satisfaction and confidence individuals seek. Across consumer behavior, digital decisions, and everyday life, too many alternatives can lead to fatigue, regret, and disengagement. 

Understanding the psychological and neural mechanisms behind choice overload does not require rejecting freedom, but rather it leads to a more intentional relationship with our decisions.  

Sources: When Choice is Demotivating: Can One Desire Too Much of a Good Thing? by Iyengar & Lepper (Journal of Personality and Social Psychology); The Paradox of Choice: Why More Is Less by Schwartz; Why Do We Have a Harder Time Choosing When We Have More Options? by The Decision Lab; On the Advantages and Disadvantages of Choice: Future Research Directions in Choice Overload and Its Moderators by Misuraca, Nixon, Miceli, Di Stefano, Scaffidi, Abbate (Frontiers in Psychology); Choice Overload: A Conceptual Review and Meta-Analysis by Chernev, Böckenholt, Goodman (Journal of Consumer Psychology); Decision Fatigue in E-Commerce: How Many Product Options Are Too Many? by Winsome Writing Team (Winsome); The Paradox of Choice: How Too Many Options Affect Consumer Decision-Making by Winsome Writing Team (Winsome). 

Margherita Ottavia Serafini 

Writer

Why Gender Pay Gap Data Mislead Us: Understanding The Dynamics Behind The Numbers 

Reading time: 8 minutes

The gender pay gap index is often perceived as a clear and straightforward indicator of inequality: the lower the gap, the more equal a society must be. Yet, when looking at European data, this assumption immediately breaks down. Countries widely recognized for their strong gender equality, such as Finland and Denmark, show some of the highest gender pay gaps in Europe, respectively of 16.8% and 14.0% in 2023. Conversely, Southern European countries, typically portrayed as less advanced in terms of labor equality, often show lower gaps, such as 2.2% in Italy, 5.1% in Malta and 8.6% in Portugal.

Figure 1: The unadjusted gender pay gap, 2023 (difference between average gross hourly earnings of male and female employees as % of male gross earnings). Source: Eurostat 
Figure 2: Gender Equality by Country, 2025. Source: World Population Review 

This counterintuitive pattern raises a key question: why do some of the most gender-progressive countries display such large pay gaps? 

Understanding the answer requires unpacking what the gender pay gap actually measures and how structural factors shape the interpretation of the data. 

A counterintuitive European puzzle: how labor participation affects the gender pay gap 

According to Eurostat, the gender pay gap represents the average difference between male and female hourly earnings across an entire economy. However, this “raw” indicator does not adjust for variables such as employment rate, seniority, working hours, occupation, or industry composition. As a result, countries with very different labor market structures can produce misleading pay gap figures. 

In the European context, Nordic countries display among the highest female labor participation rates in Europe. In Sweden and Finland, around 75-77% of working-age women are employed, compared to roughly 52% in Italy, according to the Eurostat data for 2021. This fundamental difference has two statistical consequences:  

(1) More women participate across many sectors, including high-paying but male-dominated private industries, where pay disparities are more apparent.  

(2) In low-participation countries, many women who would earn less or face structural disadvantages simply do not appear in the labor market statistics. 

This means that a “low pay gap” can reflect fewer women working, not more equal pay.

Figure 3: Female labor force participation rate in Europe, 2024 (the average for 2024 in the European countries was 54.19%.The indicator is available from 1990 to 2024). Source: The World Bank 

Structural factors shaping the gender pay gap  

A low pay gap may also reflect structural constraints, cultural norms, or barriers that discourage women from entering specific sectors, or even from participating in the workforce altogether. In Italy, for instance, women are underrepresented in high-earning private-sector roles but are comparatively overrepresented in stable public-sector professions, where pay scales are more regulated. This combination tends to compress wage differentials and therefore “artificially” decrease the gender pay gap. 

By contrast, in Nordic countries women participate across a wide range of sectors, including those with substantial wage dispersion. This results in a broader and more accurate representation of gender differences in earnings. 

In this sense as well, a low pay gap is not inherently a sign of gender parity. 

The role of part-time work and occupational segregation 

A third major factor explaining the higher gender pay gaps in Northern Europe is the prevalence of part-time employment among women. According to Eurostat, countries such as the Netherlands and Denmark have some of the highest female part-time rates in Europe, compared to Southern European countries like Portugal, Greece, or Spain. Part-time jobs tend to be paid less per hour, offer fewer opportunities for career progression, and limit access to high-responsibility roles. Although part-time work in these countries is often facilitated by supportive family policies and may be a voluntary choice, it nevertheless contributes significantly to the gender pay gap. 

This pattern results in greater salary divergence between genders, even in settings where equality norms are strong.

Figure 4: Part-time Employment in Europe, 2021. Source: Eurostat 

The Nordic Gender Equality Paradox: when generous policies widen the gap 

One of the most discussed phenomena in economic literature is the Nordic Gender Equality Paradox. Although, as previously mentioned, Nordic countries consistently lead global rankings on gender equality, research by the National Bureau of Economic Research (NBER) has shown that highly generous parental leave policies can unintentionally amplify long-term differences in earnings

In countries such as Sweden, Denmark, and Finland, parental leave systems are among the most comprehensive in the world. While these policies ensure high levels of family wellbeing, they often result in women taking longer leave periods than men, leading to a slower re-entry into the labor market. This does not suggest that generous welfare policies are harmful; rather, it highlights how well-intentioned reforms can produce unintended labor-market outcomes when uptake remains uneven across genders. 

In Nordic countries, despite continued efforts to encourage paternity leave, women still take the vast majority of parental-care responsibilities. This persistent imbalance shapes career progression and contributes to long-term differences in lifetime earnings trajectories. 

Why public perception gets it wrong 

Public understanding of the gender pay gap is often shaped by simplified narratives, headlines, or assumptions based on cultural stereotypes about specific regions. Surveys conducted by the Pew Research Center show that people tend to overestimate gender differences in some contexts and underestimate them in others. 

Many assume that Nordic countries must have both high labor equality and low pay gaps. While this is true in some dimensions, such as political representation, education, and labor participation, pay gaps capture a more complex picture involving sectoral structures, parental leave, part-time work, and long-term career dynamics. 

Similarly, countries with low pay gaps are often assumed to be more gender equal, even though low participation rates, lack of childcare infrastructure, or rigid labor markets may paint a very different picture. 

This disconnection between perception and reality underscores the importance of interpreting gender statistics with nuance and understanding what each indicator actually measures. 

Conclusion 

The gender pay gap is a useful measure, but understanding what underlies it is essential. As European data shows, a low gap does not automatically signal high equality, nor does a high gap inherently indicate poor conditions for women. Instead, the gender pay gap must be interpreted within the broader context of labor participation, occupational patterns, welfare policies, and family dynamics. 

Nordic countries exhibit higher raw pay gaps because their labor markets include almost all women, across all sectors, roles, and wage bands, and because generous parental leave policies influence long-term earnings. Southern European countries show lower raw gaps largely because fewer women work and those who do tend to be concentrated in more regulated sectors. 

A nuanced interpretation is therefore essential. Understanding the mechanisms behind the numbers allows policymakers, students, and future professionals to build a clearer picture of labor market inequalities. Only by looking beyond surface-level statistics can societies meaningfully address the structural causes of wage disparities and design interventions that move beyond appearances toward real equality. 

Sources: Eurostat; OECD; The World Bank; CEPR – VoxEU: The Nordic Model and Income Equality: Myths, Facts and Policy Lessons by Mogstad M., Salvanes K. G., & Torsvik G.; World Bank Group, Gender Data Portal; European Commission; The World Economic Forum, Global Gender Gap Report; The Economist: A Nordic Mystery; National Bureau Of Economic Research: The Child Penalty Atlas by Kleven H., Landais C., & Leite-Mariante G.; Pew Research Center, Global Attitudes on Gender Equality

Margherita Ottavia Serafini 

Writer

Female Exodus: Why U.S. Women Are Leaving The Labour Market 

Reading time: 8 minutes

Since January 2025, more than 400,000 women have been leaving their jobs in the U.S., the steepest decline in over 40 years for mothers of young kids.  

A female exodus that is dangerously erasing years of hard-won advances women made, particularly coming out of the pandemic, when flexible work policies enabled unprecedented labour participation rates.  

Remote Work Trends And The Post-Covid Peak 

On the wave of lockdowns, in May 2020 pandemics pushed almost 40% of employed Americans into working remotely. An undeniable jump, if we consider that just 3 years earlier only about 9-10% of workers would be reported working remotely. Later on, as offices reopened, that number fell, dropping to around 5.2% by September 2022 for those working remotely due to COVID.  

However, remote work itself did not disappear. The pandemic left a mark in the labour market, as by early 2024 about 22.9% of U.S. employees were still teleworking. This shows how post-pandemic remote-hybrid work remained definitely more common than it was before, despite not reaching the emergency peak of 2020. 

Figure 1: Share of employment by gender in occupations that can be performed remotely. 
Source: U.S. Census Bureau and USDOL/ETA 

Flexibility, Remote Work, and Women’s Labour Force Participation 

Historically, women have been overrepresented in roles more adaptable to remote work, such as education, administration, and knowledge-based services. Thus, it is not surprising that when flexible work options arose, many women would capitalise on them.  

For both men and women, the possibility of working remotely decreased the likelihood of dropping out of work. But this effect was more visible for women. In fact, prime-age women’s labour force participation (ages 25-54) reached record levels in the U.S., hitting around 77-78% in 2023.  

Figure 2: Labor force participation of U.S. prime-age women (1982–2025), by age of youngest child. Mothers with children under 5 peaked at 71% in 2023, then dropped to 68% in 2025. 
Source: The Hamilton Project, Brookings. 

A Brookings analysis pointed out that since 2020 the group witnessing the fastest growth in labour force participation were those mothers with children under 5 years old. For most, indeed, remote and hybrid schedules created a bridge between work and family responsibilities, particularly also among highly educated or married women. Flexibility would not just retain workers, it actually unblocked participation from those groups previously precluded by rigid schedules.  

But numbers speak loud: nowadays, something is changing.  

Unaffordable Childcare and Caregiver Burnout 

What is happening in front of our eyes is a clear childcare crisis. The stress and pressure to manage both career and childcare leave women overwhelmed and exhausted. In the U.S., many women struggle to find affordable childcare in a country with one of the highest costs in the world, often 30% or more of an average family’s income.  

Figure 3: Cost of infant care as a share of median income across U.S. states in 2024. Darker shades indicate higher financial burden. 
Source: Economic Policy Institute, via CNN.
 

Instead, countries such as Germany and Estonia have subsidised childcare, pushing down costs to near zero for many families. But many American mothers feel they have little choice but to quit their jobs. Similar story in the UK, where a recent survey has revealed that 43% of mothers revealed they had considered leaving their jobs due to childcare expenses.  

Years of underinvestment and the end of expiration of pandemic-era subsidies are leaving American childcare supply in crisis. Women who have fought for their careers are now forced to drop out to preserve their mental health and family well-being.   

Return-to-Office Mandates and Lost Flexibility 

In January 2025, President Donald Trump ordered federal employees back in-person five days a week, despite many had remote work arrangements and some had even moved far away from their offices. Major private employers, such as Amazon and JPMorgan, followed the same wave.  

It’s not a coincidence that women’s participation in the workforce is falling as flexibility disappears, says Julie Vogtman, senior director of job quality for the National Women’s Law Center. 

Yet, return-to-office policies are not proven to make companies more productive. For instance, one 2024 study Van Dijcke, Gunsilius, and Wright of resumes at Microsoft, SpaceX, and Apple found that return-to-office policies led to an exodus of senior employees, which posed a potential threat to competitiveness of the larger firm. In other words, employers are losing talented workers, whose skills and institutional knowledge are difficult to replace. A talent drain that can even weaken the overall economy’s productivity and innovation.  

To worsen things, women don’t feel respected in some workplaces, perceiving a clear cultural shift. Many have reported feeling less valued at work, with few diversity initiatives and a post-pandemic reversion to old norms.  

It’s a pure storm of fading flexibility, harsher office demands and eroded support systems.  

A McKinsey research suggests that women are even more likely to take on a lower-paying job if it implies benefits such as remote working and flexible schedules. If this trend increases, it will leave women disproportionately affected.  

Furthermore, as women leave their jobs, the Trump administration is looking for ways to encourage women to get married and have more children, so as to slow down the country’s decline in birth rate.  

Global Perspectives: Policies Matter 

“The U.S. is the only advanced economy that’s had declining female labor force participation in the last 20 years, and a lot of that is because of lack of social safety net and caregiving supports” – Kate Bahn 

Globally, about half of all women participate in the labour force, with huge regional disparities persisting.

Figure 4: Female labor force participation worldwide in 2024. Darker regions show higher shares of working-age women in the labor force, with stark contrasts between regions like Scandinavia and South Asia. 
Source: Our World in Data (2025), ILO Estimates. 

Deliberate policies have allowed women’s workforce participation to rise or held steady in many wealthy nations. Nordic countries like Iceland and Sweden lead in female employment, with gender gaps among the smallest in the world and a women’s participation rate of around 63-70%.  

These countries differ from the U.S. as they heavily invest in affordable childcare, generous parental leave, and flexible schedules. Even the UK, Canada, and China have recently improved childcare subsidies or free preschool hours to push mothers to work. France and the Netherlands have high part-time options keeping women in the labour force, whereas Japan is pushing for “women economics” incentivising female employment.  

On the other hand, countries that like the U.S. lack supportive policies see women pressed to choose between work and family, a choice that an emancipated society shouldn’t have.  

Conclusion 

Women leaving the workplace is not merely a personal or isolated decision. We are talking about a systematic problem depending on a complex interplay of societal norms, organisational practices and individual circumstances.  

Factors such as work-life balance, career progression opportunities, social norms and expectations shape many women’s career decisions. Understanding the multifaceted nature of this trend is essential for designing effective strategies to retain and support women, ultimately benefitting the overall society and economy.  

Sources: Bureau of Labor Statistics; Time Magazine; Allwork.Space; The Washington Post; University of Kansas (The Care Board/CBS News); Brookings Institution; Federal Reserve (FEDS Notes); World Economic Forum; Institute for Women’s Policy Research; KPMG; The Economist; The Hamilton Project; The New York Times; McKinsey Global Institute; Our World in Data; Qureos; Return to Office and the Tenure Distribution, Van Dijcke, Gunsilius & Wright, arXiv (2024) 

Rebecca Fratello 

Writer

Risk Repriced: How Political Instability Reshapes Market Confidence and Sovereign Costs 

Reading time: 8 minutes

When Markets Look At Politics 

We are used to thinking of financial markets as driven only by economic principles such as inflation, interest rate expectations, and growth forecasts. In this context, politics is background noise: unpredictable, difficult to quantify, and irrelevant to asset pricing. Yet this perception increasingly misrepresents reality. 

Political developments have become central to how markets interpret risk, reprice assets, and allocate capital.  

Nowadays, headlines from governments regularly trigger revaluations. Political uncertainty is growingly emerging as a source of volatility and a key determinant of sovereign borrowing costs. Every new cabinet announcement, legislative halt or budget negotiation is a signal investors have to price, quickly and with little margin for error.  

The uncertainty about future government actions may have a dual effect on market prices. In rare cases, it may represent policy flexibility against shocks. But in the majority of cases, it may actually reflect growing doubts about institutional resilience and future fiscal tracks. 

The market impact is clear: as stock prices respond to political news, political uncertainty leads to higher equity risk premium, increased asset correlation and consequently lower diversification benefits. 

To better understand how political turmoil can flow into financial markets, we can have a look at the most recent case: France. 

The French Distress 

In October 2025, France dived into a serious political turbulence after the resignation of Prime Minister Sébastien Lecornu just one day after announcing his cabinet. It’s the collapse of the fifth prime minister in just two years, a statistic that points out not just instability but a deeper fracture in the French political system. 

Public surveys reveal despair, pessimism and distrust as the prevailing feelings in French citizens. Worrying symptoms representing the profound current democratic crisis, not even two years ahead of the next presidential election.  

Financial markets, never known for patience but for how quickly they react, are clearly reflecting investors’ sentiment. Not surprisingly, French equity indices dropped, and bond markets did not do differently. For instance, yields on the 10-year French government bonds skyrocketed by 7-8 basis points, reaching around 3.58%.  The spread between French and German bond yields broadens as investors demand a premium for holding what they see as riskier sovereign debt.  

Figure 1: The yield gap widened sharply amid French political turmoil, reflecting rising investor risk premia on French debt. 
Source: LSEG via Reuters. 

The reason for this reaction? The answer is not that straightforward. No single event triggers the repricing by itself, but the clear loss of confidence in France’s fiscal policies plays an unequivocal role. The situation in France is getting complicated, both politically and economically.  

The general feeling speaks loud: France looks unable to find its way out of this malaise.  

Shifting Benchmarks 

Historically, France was perceived as relatively safe within the Euro area bond markets. Italian bonds, instead, have been telling a different story so far. Yet, trends are changing.  

Figure 2: French (red) and Italian (green) 10-year government bond yields nearly converged in late 2025, reflecting France’s political turmoil (rising yields) versus relative stability in Italy (falling yields). Source: LSEG via Reuters. 

As French borrowing costs have risen, Italian yields have followed the opposite direction. This shows how perceptions around France, once considered a core market, and Italy, long seen as one of the weakest ones instead, have radically changed. Investors are concerned that France will not be able to improve its fiscal position due to its political instability, thus pushing up its bond yields. Different story for Italy, where relative political stability and downward debt forecast have caused its bond yields to decrease.  

But be careful. For some, the narrowing of the French-Italian bond spread has more to do with French fiscal and political distress than an improvement in Italy’s market.  

Italy has been afflicted by chronic problems that will take a long time to fix. We are still talking about the euro zone’s second-largest debt as a percentage of GDP after Greece, with a growth of the economy being obstructed by a concerning falling population and low female employment.  

Still, the convergence of French and Italian bond yields serves as a striking illustration of the implications of political stability and credible budgeting on investors’ confidence.  

Indeed, global investors nowadays look at governance quality in advanced economies pretty much as economic principles to adjust their required returns. 

Impact On Growth And Market Confidence 

Beyond market volatility, political instability carries important long-term economic costs. Empirical research on advanced economies has demonstrated that an uncertain politics can cause delayed investment decisions, hard policy execution, and undermined growth prospects. In fewer words, high levels of political instability can overall cause worse economic output. 

The reasons are pretty intuitive: when governments are fragile or policy direction is unclear, businesses and consumers lose confidence. Private sectors struggle to create expectations, while public institutions turn less effective in providing structural reforms.  

But as fragmented governments are not able to enact reform, public finances deteriorate. In France, the continuous change in leadership has paralysed the adoption of a new fiscal regime, delaying important decisions on expenditure and taxation. This creates a dangerous loop: as fiscal negligence decreases investor confidence, sovereign borrowing costs increase, which displace public spending, which in turn further constrains the ability to enact future reforms.  

France, for instance, has gone through five prime ministers in just two years, its national debt exceeding €3 trillion, and it seems unable to create a credible path towards fiscal balance.  

Figure 3: France holds the third-highest debt burden in the EU, after Greece and Italy, exceeding 110% of GDP. 
Source: Eurostat.

Globally, the political instability of an advanced economy as France can have both negative and positive spillover effects on other regions as well. On one hand, investors may require higher risk premiums also from other countries perceived as politically vulnerable. On the other hand, such instability may cause a flight-to-quality flows, as capital would flow towards safer bonds such as Germany Bunds or U.S. Treasuries.   

However, the coincident fiscal crises in multiple large economies, might result in a broader reallocation of global capital away from equities and emerging markets, thus potentially threatening global growth. 

Institutions such as the IMF and OECD have pointed out how political stability and consistent fiscal policies are not only priorities at the domestic level, but also the foundations of international market confidence and macroeconomic resilience. 

Conclusion 

What France is going through right now is not just a domestic drama. We are using this case as an understanding of what can be the costs of institutional fragility in a period of high debt and fiscal uncertainty. When governments and their reforms falter, consequences can be urgent: higher borrowing costs, downgraded credit ratings, eroded currencies, and constrained growth.  

If investors would once see political risk as background noise, now they price it in their models and we need to discuss it. The bond market has become a criterion of credibility, which rewards discipline and punishes obstructions.  

The message to policymakers is clear: good governance is capital. Stability, transparency, and consistency are no more mere abstract democratic values, but economic assets bringing yield. We are still in a post-pandemic context with high interest rates and insecurities, and policy incoherence is no longer tolerated. 

Preserving market trust is vital. Governments must now handle both budgets and expectations. Credibility can be the cheapest form of stimulus for those countries facing high debt and structural change. And as France is showing, once lost, it becomes the most expensive asset to restore. 

Sources: Reuters; Euronews; Financial Times; Fitch Ratings; Eurostat; LSEG via Reuters; IMF; OECD; ECB; Political Uncertainty and Risk Premia, by Lubos Pastor & Pietro Veronesi; European Journal of Political Economy; Political Instability and Economic Growth: Causation and Transmission, by Maximilian W. Dirks & Torsten Schmidt.

Rebecca Fratello 

Writer

The Economics of Mindfulness: Why Wellbeing Is a Business Case

Reading Time: 5 minutes

Reframing Wellbeing in the Modern Workplace 

As the nature of work becomes increasingly complex, digital, and fast-paced, employee wellbeing has emerged as a critical driver of organizational success. Far from being a peripheral HR topic, psychological wellbeing directly impacts core business outcomes – from productivity and innovation to turnover and engagement. The notion that investing in wellbeing is costly or optional is increasingly contradicted by empirical evidence showing that it is, in fact, a smart economic decision. 

Workplaces where employees report higher levels of subjective wellbeing – particularly job satisfaction – demonstrate significantly better performance outcomes, including labor productivity, output quality, and profitability. These relationships persist even when controlling for other HR policies, highlighting wellbeing as a distinct and measurable source of competitive advantage. 

Moving Beyond Perks: Systemic Approaches to Wellbeing 

Workplace wellness initiatives often focus on individual-level solutions like meditation apps, fitness memberships, or lunchtime yoga. While these efforts may reduce short-term stress, they fail to address the structural conditions that give rise to chronic strain, disengagement, and mental health risks. 

Interventions are more effective at the organizational or group level. Changes to work schedules, job roles, or team dynamics – especially those that increase employees’ control and participation – have demonstrated a broader and more sustainable impact on wellbeing. Employees who have autonomy in their tasks and a voice in how work is structured consistently report higher levels of job satisfaction, lower stress, and improved work–life balance. These outcomes are amplified in environments that support open communication and shared decision-making. 

Such systemic approaches suggest that wellbeing is not the result of individual resilience, but of healthy, empowering work environments that are intentionally designed. 

Technology and the New Frontier of Workplace Wellbeing 

In response to hybrid and remote work environments, organizations are increasingly turning to digital tools to support mental health and wellbeing. From immersive virtual reality (VR) environments that simulate calming nature scenes to AI-based tools that monitor emotional states via facial expressions, biometric data, or tone of voice, technology now plays a growing role in the design of workplace wellbeing strategies. 

Virtual reality programs have shown promising results in reducing stress and promoting relaxation in various workplace settings. Even short VR interventions with nature-based visuals or guided breathing exercises have been associated with measurable improvements in employee wellbeing. These technologies can serve as accessible and time-efficient micro-breaks, particularly in demanding or high-pressure environments. 

At the same time, the use of emotional AI raises critical ethical concerns. While emotion-recognition systems promise to enhance management decisions and detect early signs of burnout, they also risk turning the workplace into a zone of surveillance. Monitoring affective states without transparent consent or context can undermine psychological safety rather than support it. If technologies are used to control rather than empower employees, they may backfire – reducing trust and increasing stress. 

The key lies in intentional design and ethical implementation. When used responsibly and transparently, digital wellbeing tools can extend access to support and complement systemic approaches to workplace culture. However, technology must remain a tool – not a substitute – for genuine human connection, autonomy, and care. 

Wellbeing as a Catalyst for Innovation 

Wellbeing not only prevents burnout – it enables innovation. Employees who perceive their work as meaningful and values-aligned are more likely to engage in creative thinking, share new ideas, and take initiative. When employees experience purpose and psychological safety, their engagement spills over into behaviors that benefit the organization as a whole. 

Studies indicate that this effect is strengthened when organizational values align with employees’ own spiritual or ethical beliefs. A sense of authenticity and shared purpose in the workplace fosters emotional connection, which in turn drives proactive contributions and innovative work behavior. 

Resilience as a Buffer to Emotional Strain 

In emotionally intense or high-stakes sectors, such as healthcare, workplace resilience plays a critical role in protecting psychological wellbeing. Employees working under high stress, such as nurses in mental health services, report substantially better wellbeing when they experience resilience-supportive conditions like strong team relationships, opportunities for growth, and autonomy in clinical decisions. Higher resilience levels are associated with lower levels of anxiety, depression, and mental distress – even when job demands remain high. 

These findings affirm multidimensional models of wellbeing, which emphasize not just happiness or the absence of illness, but the capacity to grow, feel connected, and exercise agency in the face of adversity. 

From Support Programs to Cultural Shift 

Employee Assistance Programs (EAPs) remain widely used and often valued as accessible tools for short-term counselling and support. However, their long-term effectiveness depends on integration with broader workplace strategies. EAPs that operate in isolation, without addressing organizational culture or workload issues, may offer limited benefits. When combined with systemic measures – such as leadership development, trauma-informed management, or inclusive policy changes – EAPs can serve as effective pillars within a comprehensive wellbeing strategy. 

Designing for Sustainable Human Performance 

The research is clear: organizations that invest in structural wellbeing – not just individual coping – unlock higher engagement, greater innovation, and stronger business outcomes. Mindfulness, autonomy, psychological safety, and meaningful work are not luxury goods; they are essential design principles for the future of work. 

The economics of mindfulness lies in creating environments where people can thrive – not just survive. In doing so, companies don’t just promote wellbeing – they build better, more adaptive organizations for the long term. 

Sources

Bryson, A., Forth, J., & Stokes, L. (2017). Does employees’ subjective well-being affect workplace performance? Human Relations, 70(8), 1017–1037. 

Delgado, C., Roche, M., Fethney, J., & Foster, K. (2021). Mental health nurses’ psychological well-being, mental distress, and workplace resilience. International Journal of Mental Health Nursing, 30, 1234–1247. 

Fox, K. E., Johnson, S. T., Berkman, L. F., Sianoja, M., Soh, Y., Kubzansky, L. D., & Kelly, E. L. (2022). Organisational- and group-level workplace interventions and their effect on multiple domains of worker well-being: A systematic review.Work & Stress, 36(1), 30–59. 

Kirk, A. K., & Brown, D. F. (2003). Employee assistance programs: A review of the management of stress and wellbeing through workplace counselling and consulting. Australian Psychologist, 38(2), 138–143. 

Riches, S., Taylor, L., Jeyarajaguru, P., Veling, W., & Valmaggia, L. (2024). Virtual reality and immersive technologies to promote workplace wellbeing: A systematic review. Journal of Mental Health, 33(2), 253–273. https://doi.org/10.1080/09638237.2023.2182428 

Mantello, P., & Ho, M. T. (2024). Emotional AI and the future of wellbeing in the post-pandemic workplace. AI & Society, 39, 1883–1889. https://doi.org/10.1007/s00146-023-01639-8 

Salem, N. H., Ishaq, M. I., Yaqoob, S., Raza, A., & Zia, H. (2022). Employee engagement, innovative work behaviour, and employee wellbeing: Do workplace spirituality and individual spirituality matter? Business Ethics, Environment & Responsibility, 32(3), 657–669.

Mara Blanz

Research Editor & Editor