
A Cash Economy Meets a Mobile Network
In 2007, M-Pesa was launched by Kenya, soon to become one of the most influential financial innovations in development economics. The platform was developed by Safaricom with support from Vodafone, with the aim of allowing users to send and receive money through basic mobile phones. A simple payment solution at first glance, but life changing at its roots.
Before M-Pesa, most Kenyans were under a cash-dominated and largely informal economy: bank branches concentrated in urban centres, restrictive documentation requirements, and minimum balance conditions excluding low-income households. For rural families, sending money often meant physically transporting cash or relying on informal couriers, both costly and risky.
M-Pesa was an alternative to this. Using SMS-based USSD technology, no traditional bank account was needed. Users could use basic mobile phones without internet connectivity, being able to deposit cash with local agents, store value electronically, and transfer funds instantly. In other words, it wasn’t a simple payment application, but a new layer of digital financial infrastructure.
Financial Inclusion as a Driver of Development
Financial inclusion has been theoretically and empirically demonstrated to be a catalyst for economic growth. By granting access to savings mechanisms, credit, and secure payment systems, households can smooth consumption, invest in education and healthcare, and manage economic risk. In other words, households are opened doors towards productivity and resilience.
The traditional way in which Kenyans would manage their money was highly inefficient and vulnerable to theft or loss. But with M-Pesa, financial access started moving from informal networks to formal digital systems.
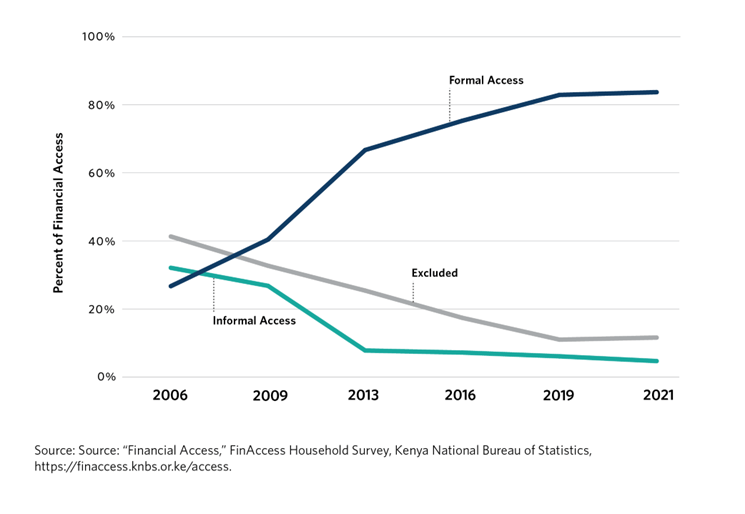
Informal reliance and outright exclusion dropped, and as shown by data, digital finance brought millions of people into the formal system.
With M-Pesa, sending money became instantaneous and significantly safer. Migrant workers in urban centres could transfer funds to relatives in rural areas without intermediaries. According to research by Tavneet Suri and William Jack, access to M-Pesa lifted around 2% of Kenyan households out of extreme poverty between 2008 and 2014.
However, aggregate expansion tells only part of the story. The distribution of access across gender reveals a deeper transformation.
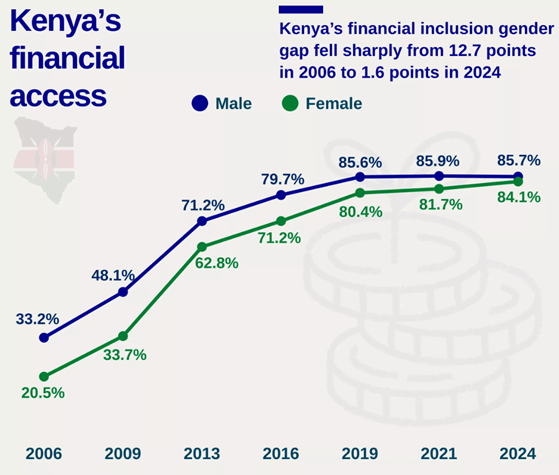
The financial inclusion gender gap, which exceeded 12 percentage points in 2006, narrowed dramatically over time. For instance, M-Pesa’s impact was particularly determining for women. After obtaining access to mobile financial services, many of them evolved from subsistence agriculture to small-scale retail and entrepreneurial activities. Barriers to entry were reduced, hence expanding economic agency and participation across previously excluded groups.
These trends speak loudly. When remittances become reliable and affordable, labour mobility increases, local businesses gain liquidity, and households become more resilient to shocks. A true structural economic change. Digital financial infrastructure can therefore function as a quasi-public good, even when delivered by a private company.
Fintech Innovation in a Low-Income Context
Clearly, M-Pesa emerged from a developing economy responding to local constraints, definitely not a high-income technology. Hence, the system was designed for simplicity and scalability. USSD technology allowed even the most basic phones to participate in the digital economy.
From a fintech perspective, M-Pesa demonstrates the power of platform-based financial ecosystems. Over time, the service expanded beyond peer-to-peer transfers to include bill payments, salary disbursement, merchant services, savings accounts such as M-Shwari, and microcredit products. Hence, as other fintech cases, the platform soon evolved into an integrated financial ecosystem operating hand in hand with traditional banks.
This trajectory challenges classical assumptions in financial development theory. Conventional models often suggest that financial deepening requires the gradual expansion of banking institutions, physical branches, and formal credit markets. Kenya experienced a form of technological “leapfrogging,” bypassing intermediate stages by leveraging widespread mobile penetration to accelerate financial integration.
Such a leapfrogging effect has inspired similar systems across Sub-Saharan Africa and parts of Asia, including Tanzania, Ghana, and Bangladesh. In several African economies, mobile money accounts now outnumber traditional bank accounts. However, adoption rates remain uneven across the continent, reflecting differences in infrastructure, regulation, and market structure.
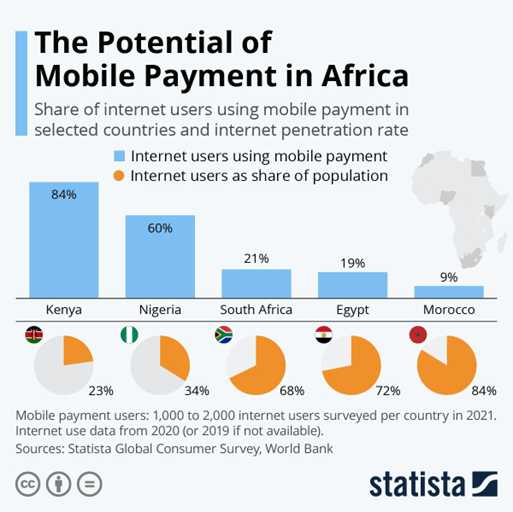
In particular, Kenya’s position within the African digital payments landscape shows both the scale of its transformation and the broader potential of mobile finance.
Macroeconomic And Structural Impacts
M-Pesa’s influence goes much beyond household-level outcomes. Over the past decade, both the volume and total value of mobile money transactions have increased exponentially, signalling the system’s growing macroeconomic significance.
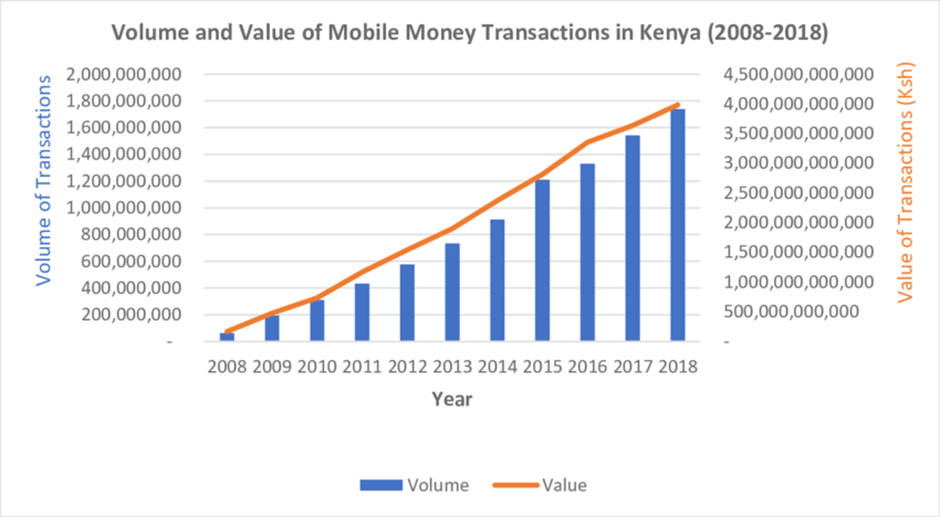
The Central Bank of Kenya reports that mobile transactions now account for a substantial share of national GDP.
Moreover, digital transaction histories provide valuable data. Typically, in development economics, information asymmetry (where lenders lack reliable information about borrowers) constraints credit markets. But by creating digital financial records, mobile money platforms mitigate such a barrier. Thus, M-Pesa contributes to the formalisation of informal economic activity, increasingly including small-scale entrepreneurs into broader financial networks.
However, rapid expansion introduces regulatory complexities. Safaricom’s dominant position in the Kenyan market has raised concerns regarding competition and interoperability. It’s essential that policymakers balance innovation with financial stability, consumer protection, and data privacy safeguards. Digital infrastructure can promote inclusion, but it also concentrates power if regulatory frameworks do not evolve accordingly.
Challenges And Future Prospects
M-Pesa’s success has transformed it from a financial innovation into a pillar of Kenya’s economic infrastructure. With that scale comes new complexity. As mobile money underpins remittances, small businesses, and even public transfers, digital platforms increasingly carry systemic importance. Operational failures, cybersecurity risks, or governance weaknesses would now have economy-wide consequences.
Market concentration and data governance present additional challenges. Safaricom’s dominance strengthens network efficiency, yet it raises concerns about competition and interoperability. At the same time, vast volumes of transactional data improve credit access but intensify debates over privacy, surveillance, and algorithmic fairness. Financial inclusion must therefore evolve alongside regulatory capacity.
The broader lesson is that inclusion is not static. As fintech ecosystems become more sophisticated, digital literacy gaps and unequal access to technology risk creating new forms of exclusion. M-Pesa’s future will depend not only on technological expansion, but on institutional design, ensuring that innovation remains inclusive, competitive, and resilient.
In this sense, the Kenyan experience does not mark the end of a development story, but the beginning of a new policy frontier: how to govern digital finance as a public economic utility.
Sources: World Bank Global Findex Database; Central Bank of Kenya Annual Reports; Suri, T. & Jack, W. (2016), The Long-Run Poverty and Gender Impacts of Mobile Money, Science; GSMA State of the Industry Report on Mobile Money; Safaricom Annual Reports; MIT News; Financial Times; United Nations Development Programme.

Rebecca Fratello
Writer


 Bruegel based on European Commission (2023a)