

Reading time: 7 minutes
Economic growth is verified once in a while in virtually every country across the globe. As a matter of fact, economic growth as it is is almost as unavoidable as an economic recession at least in a point in time. What is truly hard to achieve is lasting economic growth, as it demands some features which seldom coexist in a country. In this article, four of them are analyzed, in an attempt to shed a light on why some economies thrive, while others seem doomed to failure.
Economic diversification
When Botswana grew at an average rate of 13% per year during the 1970s and 1980s, soon after conquering independence from the United Kingdom, people thought they were in face of the ultimate economic miracle (Graph 1). Economic expansion in the Southeast African country just seemed unstoppable. This period coincided, however, with a world high in the price of diamonds, which the Botswanan economy heavily relied on (diamonds account for about 60% of government revenue). When prices fell in the 1990s, they were not able to sustain the remarkable expansion they had registered until then.
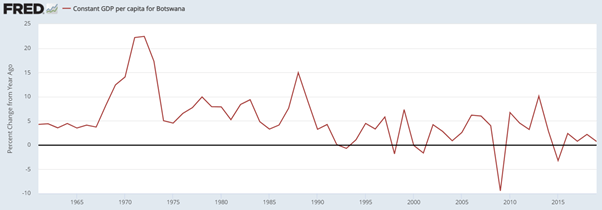
Source: Federal Reserve Economic Data
In turn, other countries such as Angola and Venezuela, have shown a great dependence from oil prices to improve their general living standards, facing deep recessions whenever there was a trough in this market.

Source: Federal Reserve Economic Data
As a matter of fact, these countries have other structural problems, which will be explored throughout the article, but it is undeniable that the lack of economic diversification exposes them to large fluctuations in commodities’ prices.
On the other hand, if we look at a set of developed countries which are also world leaders in oil reserves, such as the United States, Canada or Norway, one can understand that they are much more insulated from the evolution of commodities’ prices (Graph 3). Even though one can spot a significant correlation between the growth rate of these countries’ GDP and the trough in oil prices in 2008 and 2009, for instance, this does not imply causality, as this was also the time of the great financial crisis. Furthermore, all these countries were able to grow steadily, for example, in the beginning of the century, when the oil price was everything but favorable. This must mean they have other sources of growth, as opposed to countries like Venezuela or Angola. When an economy is not diversified, people are subject to wider income variations, leading to social unrest and, therefore, to greater difficulty in implementing the so-needed structural reforms.

Source: Federal Reserve Economic Data
These conclusions allow us to hereby distinguish Group 1 (Botswana, Venezuela, Angola) from Group 2 (United States, Canada, Norway) countries.
Productivity expansion
Beyond resource endowment dependence, Group 1 countries exhibit stagnant productivity levels. Despite widely discussed among economists, the true nature of the term productivity is fairly unclear to the common reader.
Taught in virtually every business school, Robert Solow (1987 Economics Nobel Prize) came up with a model which allows one to better understand the concept. Put simply, he argued that a country’s GDP could increase via mere labor (workers) and capital (machines) accumulation. Nonetheless, he sustained that long-term economic growth could only be achieved as long as the output each worker or machine produced increased as well – that corresponds to a productivity improvement. Otherwise, growth would not be sustainable in the long run, as inputs depreciate, meaning they lose value (e.g.: the likelihood of a machine needing to be fixed increases with its useful life). Productivity is, therefore, a measure of efficiency of production, which, when high, can lead to greater profits for businesses and income for individuals. Conversely, when low, a country cannot aim at achieving lasting growth.
Comparing Group 1-alike countries (this time, focusing temporarily on Ecuador and Nigeria, due to the lack of data for Angola and Botswana) with Group 2 countries, one can clearly observe that growth in labor productivity is once more very dissimilar (Graph 4). This difference is also embodied in the remarkable dissimilarity in absolute productivity levels, but that fact directly departures from different growth rates. In fact, in the 1970s, absolute levels were not that different – a great divergence only arose when Group 2 nations consistently outperformed Group 1 countries.

Source: Our World in Data
Incipient productivity growth is, therefore, one of the reasons why some countries do not thrive, but it is also a direct consequence of another flaw – lack of openness to trade.
Openness to trade
The benefits of free trade go back to David Ricardo. He defended that it allowed countries to specialize and increase their productivity, translating into a higher national welfare. More specifically, trade made it possible for countries to access goods which otherwise would not be reachable and sell products whose production they were relatively more productive in (concept of comparative advantage). The greatest advantage from international trade is, nevertheless, the exposure of national firms to greater competition, forcing them to constantly improve production processes, which has a direct positive impact on productivity.
When comparing Group 1 with Group 2 countries, one can, once again, identify quite decisive differences between them in this regard. This time, however, Botswana is spotted half-way through to Group 2 countries. The African country exports mainly beef and diamonds and, although the products it sells abroad are not particularly diverse, it does not seem eager to avoid foreign, more efficient firms to access domestic markets. The same cannot be said regarding Venezuela or Angola, where barriers to trade are enormous. Speaking about Venezuela, oil exports have been steadily decreasing since the highs of 2014. Also, the fact that the country has the world’s largest oil reserves makes gasoline shortage today a bit ironic. On the other hand, Group 2 countries have historically been great supporters of international trade, allowing firms to access cheaper raw materials and to find new markets. Consequently, this set of countries proves it is possible to be blessed with natural resources, while still having organized societies and developed industrial and service sectors. All in all, embracing world trade is highly correlated with long-term economic growth. In reality, the great economic boom after World War II was mainly pushed by an increase in the relative importance of exports in the global scenery, as shown by Graph 5.

Source: Our World in Data
Inclusive institutions
Despite being needed to achieve economic diversification, productivity growth and greater openness to trade, structural reforms are only possible to implement as long as national institutions support them. This is a major problem in Group 1 countries, especially in Venezuela and Angola. Indeed, there is a notorious lack of democratic institutions in these countries, which are also characterized by high corruption levels.
As a matter of fact, in the 2019 Corruption Perceptions Index, which ranks countries in terms of corruption from 0 (very corrupt) to 100 (very clean), they registered very low values, while the United States, Canada and Norway scored relatively higher values (Graph 6). Botswana is in the middle. It is, therefore, of no coincidence that Botswana is the best-performing country among Group 1 countries.

Data sources: The Heritage Foundation, Transparency International
Overall, corruption results in lower levels of capital productivity. As corrupt government favor private interests, it often gets stuck in a state of inefficiency (no incentives to control costs), led by wasteful rent-seeking (manipulate economic conditions to generate profit) and distorted public decision-making. The side-payments involved and hidden within each transaction create an unstable amount of uncertainty, which not only serves as an incentive not to engage in economic exchanges and disincentivizes investment, but promotes of these corrupt transactions. Moreover, the misaligned incentives result in an inefficient allocation of resources.
Another dimension in which institutions can be evaluated is through the 2020 Economic Freedom Index, where results are similar to those regarding corruption (Graph 6). In this regard, empirical data support the fact that liberalization induces growth, despite significant gaps in the levels of productivity and economic freedom index between groups of countries. So, the patterns verified across these countries are once more consistent with the existing data.
This reaffirms the importance of inclusive institutions – a term coined by Acemoglu and Robinson in Why Nations Fail – where property rights are respected, justice is effective and government spending is wise and clean-fingered. Only institutions providing the right incentives to individuals and businesses can bring continuous prosperity.
Heading towards lasting economic growth
Sustainable prosperity directly relies on economic diversification, productivity expansion and international trade. However, these three golden rules demand a fourth – inclusive institutions. This explains why some people get very rich and other struggle to accumulate some wealth across the globe. As long as institutional flaws persist, so will economic stagnation. This is perhaps the most important problem developing countries face nowadays.
Sources: Federal Reserve Economic Data, JSTOR, Our World in Data, ResearchGate, Statista, The Heritage Foundation, The Independent
Scientific revision: Patrícia Cruz

Gonçalo Silva

Mariana Soares

Nuno Sampayo

Rodolfo Carrasquinho
