
On November 6th, German Chancellor Olaf Scholz announced in a speech to the media having dismissed Finance Minister Christian Lindner. This was followed by a wave of demissions in one of the three parties forming the ruling coalition, essentially making the government collapse. To understand this crisis, it is important to go back in time.
Indeed, Germany’s current political instability is deeply rooted in the nation’s economic challenges over the past decade, shaped by both internal policy decisions and global economic forces. To understand the collapse of the coalition government (a government formed jointly by more than one political party) and the broader political crisis, it is essential to explore the economic context that led to this pivotal moment.
Wirtschaftswunder – “Economic Miracle”
After World War II much of the country was in ruins. Allied Forces had attacked or bombed large parts of its infrastructure. The city of Dresden was completely destroyed, the population of Cologne had dropped from 750,000 to 32,00 inhabitants, Germany was a ruined state facing an incredibly bleak future. Nevertheless, by 1989, when the Berlin Wall fell and Germany was once again reunited, it was the envy and surprise of most of the world.
Germany had the third-biggest economy in the world, trailing only Japan and the United States in terms of GDP. Its post-World War II “economic miracle” was built on industrial excellence, a strong export sector, and a model of social capitalism that balanced growth with social welfare.
By the early 2000s, Germany had established itself as the world’s fourth-largest economy, heavily reliant on the automotive, mechanical engineering, chemical and electronic industries alongside having the most open economy of the G7 states.
Economic Challenges and Impact of Global Events
Even though the country’s growth was exponential and undeniable, flaws in the economic model began to arise. One of them lies with demographic pressures, given the fact that this country´s ageing population has strained its workforce and social welfare systems, particularly pensions and healthcare aligned with an increase in immigration that reduced innovative minds, falling behind in sectors like digital technology and artificial intelligence, sparkling political debates and polarisation.
Additionally, the overreliance on exports, particularly to China and the United States, left the economy vulnerable to external shocks, such as trade wars and global demand slowdowns. Proof and enhancement of this was the disruption of global supply chains due to Covid-19 Pandemic, that reduced demand for German exports, and forced the government to implement costly stimulus packages, increasing public debt.
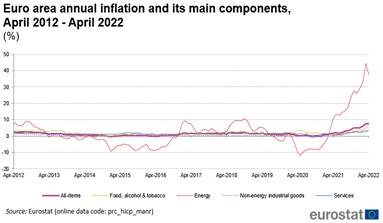
Also, because this is a country moved and known for its industrial production, heavily relying on Russian energy, became a direct liability of when the 2022 invasion of Ukraine and subsequent sanctions. This energy crisis had severe industrial impacts on this country’s competitiveness. This conflict exacerbated Germany’s energy crisis, as Russia cut off gas supplies in retaliation for European sanctions, leading to skyrocketing energy costs, prompting a turn towards renewable energy (turn that has faced criticism for its slow implementation and high costs, intensifying debates over the viability of the transaction amid soaring energy prices and industrial pushback), and alternative suppliers but also driving inflation and recession fears.
The Economic Fallout: A Path to Political Crisis
Germany officially entered a period of recession in 2023, marking two quarters of negative GDP growth (-0.1% in Q2 2023 and -0.4% in Q4 2023). Along with high inflation (ranging from 8.7% to 3.7% in 2023), eroding consumer purchasing power, shrank the economy.
German industry leaders expressed frustration over rising taxes and regulatory hurdles, particularly regarding environmental policies, fuelling demands for more pro-business reforms.
This inability of the government to reconcile competing economic philosophies (fiscal austerity, backed by the FDP) with an increased public spending (supported by the SPD and the greens) has been a persistent source of pressure on Germany’s coalition government, reaching a breaking point in November of 2024.
Current crisis
Germany, which had already been facing a strenuous economic downturn as mentioned above, saw its government collapse on November 7th, after Chancellor Olaf Scholz dismissed Finance Minister Christian Lindner over budget disagreements, causing the breakup of the country’s ruling coalition. Since 2021, Germany had been governed by a three-party coalition, commonly referred to as the “traffic light” after the parties’ traditional colours, consisting of the Social Democratic Party of Germany (SPD), The Free Democratic Party of Germany (FDP), and The Greens. When Chancelor Scholz, leader of the SPD, fired Minister Lindner, leader of the FDP, a wave of resignations from the FDP and the party’s withdrawal from the coalition ensued, leaving the government without a majority and prompting a snap election to be scheduled for February of next year. Indeed, Scholz initially announced he would continue working with The Greens in a minority government and call a confidence vote for January 15th which, if lost, could allow elections to be held in March of 2025 instead of September when they would have happened without the turmoil. However, under pressure from the opposition party, the Christian Democratic Union of Germany (CDU), the vote of confidence was pushed to December 11th and, since the government is expected to lose the backing of the parliament, elections have been set for February 23rd according to statements lawmakers and officials from three major parties gave POLITICO. Scholz’s decision to fire Lindner came after months of tensions, mainly regarding the country’s budget policy, since Scholz and the SPD’s left-wing tendencies for government spending on social and environmental policies clash with Lindner and the FDP’s neoliberal advocacy for a free market and a conservative fiscal approach. The governance was therefore certainly not smooth. Last year, for instance, the country found itself in a fiscal scandal when it was discovered that the government had been unlawfully using “special funds” to spend outside the main budget and circumvent the constitutional “debt brake” put in place, which restricts the federal deficit at 35% of GDP, preventing the government from borrowing excessively and amassing debt. After this scandal, the relationships within the coalition kept worsening, as well as public opinion of the government. This year, a week before the events, in the midst of debate on ways to prevent a 10-billion-dollar gap in next year’s budget, a paper written by Lindner listing financial and economic proposals that had not been agreed upon with other parties, including cutting welfare payments, reducing climate protection measures and implementing tax cuts for companies, was made public. Lindner then rejected Scholz proposals for the 2025 budget, which included taking out additional debt to bring down energy prices, offer tax benefits to increase investment and increase support for Ukraine. When he addressed the media on the 6th of November, Scholz stated having dismissed Lindner for blocking his economic policies, telling reporters he “showed no willingness to implement any of our proposals” and highlighting the lack of “trust basis for any future cooperation” as he argued that Lindner’s “egoism is totally incomprehensible”. On his side, Lindner reproached Scholz for having demanded a pause on the debt brake.
This political crisis was kickstarted just hours after Donald Trump’s victory in the US elections was announced, an event which not only largely overshadowed the German crisis in the media but could also have even further implications for Germany and the rest of Europe.
Consequences on a national and international scale
Scholz’s government has grown increasingly unpopular in Germany, with Scholz being one of the least popular chancellors ever, according to a CNN opinion poll. In fact, in the European Parliament elections back in June, the traffic light coalition took a blow with Scholz SPD’s recording their worst result in a national vote in over a century, with less than 14% of votes for a party that has been central in the German political landscape for so long. The Greens and the FDP also saw bleak results with 12% and 5% of votes respectively, while the center-right Christian Democrats (CDU), former Chancellor Angela Merkel’s party, were clearly in the lead with more than 30% of the votes. The far-right Alternative for Germany (AfD) also emerged with strong results, finishing second with 16%, a gain of 5 percentage points compared to the 2019 EU election, even though the party’s top two candidates for the election were involved in a series of allegations of misconduct involving suspected espionage and potential Russian influence, and the party’s lead candidate, Maximilian Krah, was forced to stop campaigning after he defended members of Hitler’s Waffen-SS as not “automatically” criminals. Far-right AfD, as well as the recently formed and controversial populist far-left BSW, have increasingly captivated voters disappointed with the main parties.
Friedrich Merz, the leader of the opposition right-wing conservative CDU, was the one to pressure Scholz into holding his vote of confidence sooner. Merz is expected to win in the snap election, according to polls where CDU is leading with 32% of support. In contrast with his predecessor Angela Merkel, Merz has highlighted the need to close the country’s borders to asylum seekers and has used his X account to show his dislike for criminal immigrants as well as gender-inclusive vocabulary. The latter clearly benefits from an earlier election considering his party’s current popularity, while the SPD would need more time to improve its standing. In polls, the SPD stands at just 16 percent, behind the far-right AfD. However, because the CDU has vowed not to form a coalition with the AfD, it could be forced to turn to the SPD despite their different ideologies and views on issues like the financial support for the unemployed put in place by the center-left party or their spending on environmental protection, frowned upon by the CDU. Moreover, based on current fragmentation and polls, they will probably need a third party with which to rule with two main contestants being The Greens, who are not at all politically aligned with the CDU, and the FDP, who are a better fit for the latter with their free-market stance, but seemingly not for the SPD. Furthermore, the FDP is at risk as it stands below the threshold they need to make it into the parliament.
To sum all this up, Germany’s political turmoil seems to be set to last even past the election, which may lead to another bumpy coalition.
All the while this has been happening, Ukraine’s situation has worsened with the beginning of the winter months. Its main allies in the EU, France and Germany, are both dealing with political instability. Furthermore, Trump’s win in the US elections has also left Ukraine in a delicate position as the future president threatened to cut US aid to Ukraine and encouraged Russia to “do whatever the hell they want” to any NATO member that fails to pay its defence bills as part of the Western military alliance. Given these circumstances, Germany, who is the second biggest contributor of military aid to Ukraine after the US, is expected to increase its support as well as strengthen its own defence and influence other European nations to do the same. This seems a rather difficult task with the country’s recent political crisis and unpassed budget for 2025 despite both the CDU and the SPD sharing the same stance on increasing support for Ukraine, with the CDU being even more decisive on the matter.
Trump’s victory also has further implications for Germany as the politician has promised to increase tariffs on imported goods, including German cars, which would certainly worsen the already precarious economic situation.
Conclusion
Reflecting on Germany’s journey, makes evident that the nation has skilfully navigated a path from devastation to resilience, emerging as a powerhouse within Europe. However, its current political and economic state reflects the complexities of trying to maintain this status amidst evolving challenges. From shifts in global markets and energy policies to addressing societal issues like integration and climate change, this country finds itself in a difficult situation to get out of. The choices it makes now, grounded in its historical lessons and forward-thinking policies, will not only shape its domestic stability but also influence the broader European and global order.
Sources: “The Economy in Germany.” 2024.; “The German Economic Miracle Post WWII.” Thomasbeard; “Germany’s Economic Growth Challenges – Economist Intelligence Unit.” Economist Intelligence Unit; VisualEconomik; TRADING ECONOMICS; Fair Observer; “Germany Engulfed; The Guardian; IPS; ZDFheute Nachrichten; Dw.Com; POLITICO

Laura Casanova

Marta Nascimento