WHO WERE THE NEANDERTHALS?

Neanderthals, scientifically Homo Neanderthalensis, the most similar species to Homo sapiens, have long been imagined as aggressive and intellectually inert creatures, roaming the earth and throwing stones and sticks everywhere. However, in the last few decades, studies have led many to believe that there is much more to be said about these early humans. Not only did they possess many cognitive abilities, but they also originated the earliest rudimentary forms of sacred rituals and art.  

 The oldest known Neanderthal fossil is estimated to be 430 thousand years old. It was found in the Atapuerca Mountains, in Spain, and consists of the skull of a man whom archaeologists called “Miguelón”. On the other hand, the most recent traces of their lives date back to 40 thousand years ago. Hence, it is assumed that they existed during that time.  

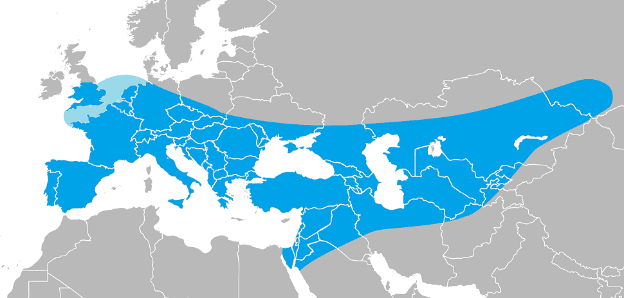
 Spain and other European countries are not the only ones that were once home to these prehistoric humans. Because they lived through glacial and interglacial periods for millennia, this might have been a driving force for searching for food and warmer temperatures, leading to migration. Consequently, it is possible to find traces of their existence from Portugal to Central Asia, not only in fossils and artifacts, but also in ourselves: almost every European and Asian citizen carries up to 4% of their DNA.  

 What did they look like? 

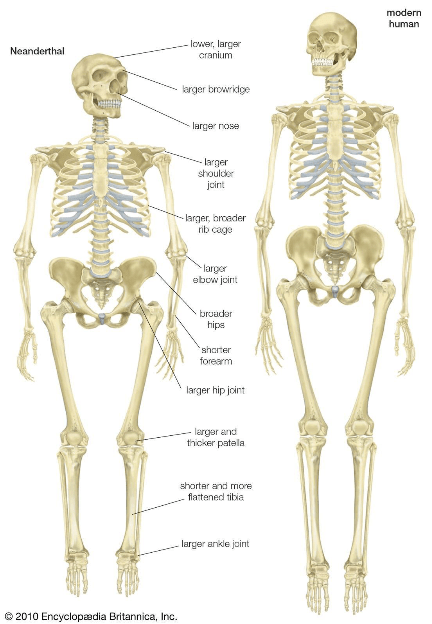
 While Homo Sapiens’ physiology enables us to run at high velocities and move nimbly compared to some other similar species, Neanderthal´s attributes were a little bit different. They were shorter, heavier, with smaller and wider limbs and torsos. Their muscular mass was much more prominent, providing high levels of strength and resistance in the wild world. This also allowed them to preserve more heat in their bodies, something essential to survive in cold temperatures during the glacial ages. Besides, as they evolved in Europe and in central Asia, where the climate was harsher than in Africa (where Homo Sapiens came from), it is believed that these physical characteristics developed to guarantee adaptation in these areas. Their faces also had wider noses that helped the air be heated before reaching the lungs and jaw bones that grew forward until late adolescence.  

 How were their minds? 

 Neanderthal´s brains were also very characteristic, being the same size or larger than modern human ones. Bigger parts were allocated to vision and body movement and control. This also explains why their eyes were wider and their vision was better.Nevertheless, minor areas were directed at social cognitions. Consequently, their interactions were probably not as rich and didn´t play as an important part in their lives as in Homo Sapiens´.  So, they didn´t build big social networks, preferring to live in small groups. This is beneficial in some cases, for example, the need to collaborate and take care of many members is not incessant, which could facilitate decision-making and movement from place to place. However, exchanging information, passing downknowledge through generations, and building some sort of culture are essential activities to lead populations to prosper and evolve throughout history. When that didn´t happen, extinction became easier and more common.  

 What did they eat and what did they do? 

 Living in a time where agriculture was nowhere in sight, hunting and gathering what was found in Nature was probably the major occupation of Neanderthals. Even though they have been imagined killing beasts like mammoths and sabretooth tigers, that idea is not entirely correct. Professor John Speth, from the University of Michigan, stated: “Neanderthals were not hypercarnivores; their diet was different.” Studies show that one common habit was letting large quantities of meat putrefy, hoping that it would attract mostly maggots, which are much easier to collect and consume. Besides, these little beings were a great source of protein, fat, and amino acids. Tubers, fruits, seeds, and plants as well as cannibalism contributed to their omnivorous diet.  

 Neanderthals used many small objects to serve various purposes in their daily activities. Items such as axes, scrapers, carved rocks, and burins helped with hunting and domestic tasks. Fire was already a controlled element, through techniques such as percussion with flint and pyrite. It contributed to body heating and cooking tasks. Flaking techniques assisted them in manufacturing clothing from animal skins, bones, and fur.  

What did they create? 

 Notwithstanding, these sorts of items were also used with a symbolic meaning. Neanderthal remains that carried necklaces with eagle talons as pendants, as well as shells and feathers, have been found across more than 20 places in Western Europe. It is common that the objects that everyone carried meant something about their lives or role in the social group and were a tool for non-verbal communication. This also reveals that burial rituals could be practiced. In France, in a cave called La Chapelle-aux-Saints, in 1908, an untouched skeleton was discovered. More recent excavations concluded that the depression where it was found had been altered 50 000 years ago to bury this man or woman. That way, it remained protected from weather-related smoothing and animals.  

 In many cases, not only bones were found, but also paintings on the walls.  

In three different spots in Spain, after analyzing their pigments, researchers concluded that the paintings were at least 65 000 years old, being the oldest ones in the whole world. This raised a question: why were the first ever cave paintings found in Europe, rather than in Africa, where Homo Sapiens appeared? Besides, it is known that the first modern humans arrived in Europe around 50 000 to 40 000 years ago. More recently, in 2018, it was concluded that other artworks in Cueva de los Aviones, were at least 115 000 years old. This left scientists with one possible answer: Neanderthals were also artists. This raised various debates, where many started defending that they were not as different from Homo Sapiens as it was thought. Moreover, prejudice regarding their level of cognitive capacities, where modern humans crown themselves as being the smartest species of all time, might be led by presumption and not by real facts.  

 How did they become extinct? 

 Neanderthal’s extinction occurred around 40 000 years ago. Several theories have emerged to justify this fact. Many defend that this is simply nature running its course, since 99.9% of all species that ever existed have disappeared. Curiously, this prehistoric human extinction coincided with the migration and expansion of Homo Sapiens outside of Africa. Many experts claim that this extinction happened due to the competition and violence between the two species. Maybe Neanderthals had worse weapons to defeat the modern man or lost in the search for food and shelter. Perhaps, as they lived in smaller gatherings, they couldn’t procreate as much. Nevertheless, other theories suggest that instead of being violence the reason for their extinction, it was sex. Inbreeding between the two species might have caused a reduction in sexual relations between Neanderthal´s, which made their populations become smaller until they were outnumbered by Homo Sapiens. Another hypothesis is that a thousand-year cold snap that occurred around 40 000 years ago may have caused their population´s decline.  

  Conclusion 

 All in all, Neanderthals were far more complex and capable than the stereotypical image that has long defined them. Rather than viewing them as inferior, it may be more accurate to see them as different, yet remarkably similar to us. Whatever the reasons for their disappearance, their legacy did not entirely disappear, as traces of their DNA still live in human populations. There will forever be endless questions regarding their lives, the answers to which are timelessly buried in the past, and in the mute land they once walked on.  

Sources for the text 

https://www.nationalgeographic.com/history/article/who-were-the-neanderthals

https://www.nationalgeographic.com/history/article/neanderthals-extinction-homo-sapiens

https://anthrosource.onlinelibrary.wiley.com/doi/full/10.1111/aman.13654

https://www.britannica.com/topic/Mousterian-industry

https://www.nationalgeographic.com/culture/article/130911-neanderthal-fashion-week-clothes

https://www.nationalgeographic.com/culture/article/131216-la-chapelle-neanderthal-burials-graves

https://www.nationalgeographic.com/science/article/neanderthals-cave-art-humans-evolution-science

https://www.nationalgeographic.com/environment/topic/climate-change

https://www.pnas.org/doi/10.1073/pnas.1808647115

https://www.nationalgeographic.com/science/article/news-neanderthal-teeth-nursing-seasons-stress

https://www.nhm.ac.uk/discover/news/2022/october/neanderthal-extinction-maybe-caused-sex-not-fighting.html

https://www.britannica.com/topic/Neanderthal~

https://www.nhm.ac.uk/discover/who-were-the-neanderthals.html

https://humanorigins.si.edu/evidence/human-fossils/species/homo-neanderthalensis

https://europe.factsanddetails.com/article/entry-814.html

https://www.science.smith.edu/climatelit/disappearance-of-the-neanderthals-c-40000-bp/

Sources for the images 

https://www.worldhistory.org/image/5958/geographical-range-of-neanderthals/

https://www.britannica.com/topic/Homo-sapiens/Bodily-structure

https://www.theguardian.com/science/2012/apr/18/favourite-science-writing-sleeping-neanderthals

https://www.theguardian.com/artanddesign/2018/feb/23/neanderthals-cave-art-spain-astounding-discovery-humbles-every-human

Júlia Lobão

Writer

M-pesa: How Mobile Money Transformed Financial Inclusion and Redefined Development Finance 

A Cash Economy Meets a Mobile Network

In 2007, M-Pesa was launched by Kenya, soon to become one of the most influential financial innovations in development economics. The platform was developed by Safaricom with support from Vodafone, with the aim of allowing users to send and receive money through basic mobile phones. A simple payment solution at first glance, but life changing at its roots.

Before M-Pesa, most Kenyans were under a cash-dominated and largely informal economy: bank branches concentrated in urban centres, restrictive documentation requirements, and minimum balance conditions excluding low-income households. For rural families, sending money often meant physically transporting cash or relying on informal couriers, both costly and risky.

M-Pesa was an alternative to this. Using SMS-based USSD technology, no traditional bank account was needed. Users could use basic mobile phones without internet connectivity, being able to deposit cash with local agents, store value electronically, and transfer funds instantly. In other words, it wasn’t a simple payment application, but a new layer of digital financial infrastructure.

Financial Inclusion as a Driver of Development

Financial inclusion has been theoretically and empirically demonstrated to be a catalyst for economic growth. By granting access to savings mechanisms, credit, and secure payment systems, households can smooth consumption, invest in education and healthcare, and manage economic risk. In other words, households are opened doors towards productivity and resilience.

The traditional way in which Kenyans would manage their money was highly inefficient and vulnerable to theft or loss. But with M-Pesa, financial access started moving from informal networks to formal digital systems.

Financial Inclusion Measured by Access in Kenya (2006–2021).

Informal reliance and outright exclusion dropped, and as shown by data, digital finance brought millions of people into the formal system.

With M-Pesa, sending money became instantaneous and significantly safer. Migrant workers in urban centres could transfer funds to relatives in rural areas without intermediaries. According to research by Tavneet Suri and William Jack, access to M-Pesa lifted around 2% of Kenyan households out of extreme poverty between 2008 and 2014.

However, aggregate expansion tells only part of the story. The distribution of access across gender reveals a deeper transformation.

Share of Male and Female Adults (18+) Who Are Financially Included, 2006–2024.

The financial inclusion gender gap, which exceeded 12 percentage points in 2006, narrowed dramatically over time. For instance, M-Pesa’s impact was particularly determining for women. After obtaining access to mobile financial services, many of them evolved from subsistence agriculture to small-scale retail and entrepreneurial activities. Barriers to entry were reduced, hence expanding economic agency and participation across previously excluded groups.

These trends speak loudly. When remittances become reliable and affordable, labour mobility increases, local businesses gain liquidity, and households become more resilient to shocks. A true structural economic change. Digital financial infrastructure can therefore function as a quasi-public good, even when delivered by a private company.

Fintech Innovation in a Low-Income Context

Clearly, M-Pesa emerged from a developing economy responding to local constraints, definitely not a high-income technology. Hence, the system was designed for simplicity and scalability. USSD technology allowed even the most basic phones to participate in the digital economy.

From a fintech perspective, M-Pesa demonstrates the power of platform-based financial ecosystems. Over time, the service expanded beyond peer-to-peer transfers to include bill payments, salary disbursement, merchant services, savings accounts such as M-Shwari, and microcredit products. Hence, as other fintech cases, the platform soon evolved into an integrated financial ecosystem operating hand in hand with traditional banks.

This trajectory challenges classical assumptions in financial development theory. Conventional models often suggest that financial deepening requires the gradual expansion of banking institutions, physical branches, and formal credit markets. Kenya experienced a form of technological “leapfrogging,” bypassing intermediate stages by leveraging widespread mobile penetration to accelerate financial integration.

Such a leapfrogging effect has inspired similar systems across Sub-Saharan Africa and parts of Asia, including Tanzania, Ghana, and Bangladesh. In several African economies, mobile money accounts now outnumber traditional bank accounts. However, adoption rates remain uneven across the continent, reflecting differences in infrastructure, regulation, and market structure.

The Potential of Mobile Payment in Africa.

In particular, Kenya’s position within the African digital payments landscape shows both the scale of its transformation and the broader potential of mobile finance.

Macroeconomic And Structural Impacts

M-Pesa’s influence goes much beyond household-level outcomes. Over the past decade, both the volume and total value of mobile money transactions have increased exponentially, signalling the system’s growing macroeconomic significance.

Volume and Value of Mobile Money Transactions in Kenya (2008–2018).

The Central Bank of Kenya reports that mobile transactions now account for a substantial share of national GDP.

Moreover, digital transaction histories provide valuable data. Typically, in development economics, information asymmetry (where lenders lack reliable information about borrowers) constraints credit markets. But by creating digital financial records, mobile money platforms mitigate such a barrier. Thus, M-Pesa contributes to the formalisation of informal economic activity, increasingly including small-scale entrepreneurs into broader financial networks.

However, rapid expansion introduces regulatory complexities. Safaricom’s dominant position in the Kenyan market has raised concerns regarding competition and interoperability. It’s essential that policymakers balance innovation with financial stability, consumer protection, and data privacy safeguards. Digital infrastructure can promote inclusion, but it also concentrates power if regulatory frameworks do not evolve accordingly.

Challenges And Future Prospects

M-Pesa’s success has transformed it from a financial innovation into a pillar of Kenya’s economic infrastructure. With that scale comes new complexity. As mobile money underpins remittances, small businesses, and even public transfers, digital platforms increasingly carry systemic importance. Operational failures, cybersecurity risks, or governance weaknesses would now have economy-wide consequences.

Market concentration and data governance present additional challenges. Safaricom’s dominance strengthens network efficiency, yet it raises concerns about competition and interoperability. At the same time, vast volumes of transactional data improve credit access but intensify debates over privacy, surveillance, and algorithmic fairness. Financial inclusion must therefore evolve alongside regulatory capacity.

The broader lesson is that inclusion is not static. As fintech ecosystems become more sophisticated, digital literacy gaps and unequal access to technology risk creating new forms of exclusion. M-Pesa’s future will depend not only on technological expansion, but on institutional design, ensuring that innovation remains inclusive, competitive, and resilient.

In this sense, the Kenyan experience does not mark the end of a development story, but the beginning of a new policy frontier: how to govern digital finance as a public economic utility.

Sources: World Bank Global Findex Database; Central Bank of Kenya Annual Reports; Suri, T. & Jack, W. (2016), The Long-Run Poverty and Gender Impacts of Mobile Money, Science; GSMA State of the Industry Report on Mobile Money; Safaricom Annual Reports; MIT News; Financial Times; United Nations Development Programme.

Rebecca Fratello 

Writer

Dopamine In The Digital Age: How Technology Is Reshaping Our Reward System 

Over the past two decades, digital technologies have become deeply embedded in everyday life. Smartphones, social media, and streaming services provide constant access to information, entertainment, and social interaction. While these tools offer undeniable benefits, researchers increasingly question how such continuous stimulation may influence the brain’s reward system. In particular, scientists have begun to examine how modern technologies interact with dopamine pathways, the neural circuits involved in motivation, learning, and reward processing. 

Understanding this relationship is crucial, as the same biological mechanisms driving curiosity and goal-directed behavior may also make individuals vulnerable to compulsive digital habits. 

The brain’s reward system 

Dopamine is a neurotransmitter involved in the brain’s reward and motivation systems. Contrary to popular belief, dopamine is not simply the “pleasure chemical.” Instead, neuroscientists describe it as a signal that helps the brain anticipate rewards and learn from experiences. When individuals encounter a rewarding stimulus, dopamine activity increases, reinforcing behaviors that may lead to future rewards.  

As neuroscientist Wolfram Schultz explains, dopamine neurons encode what is known as a “reward prediction error”, meaning they signal the difference between expected and actual rewards. This mechanism helps individuals learn which actions are worth repeating. 

Importantly, the reward system evolved to support survival. Activities such as eating, social interaction, or exploration naturally stimulate dopamine release, reinforcing behaviors that historically increased the chances of survival and reproduction. 

Figure 1: Simplified representation of the brain’s dopamine reward pathway, involving the ventral tegmental area, nucleus accumbens and prefrontal cortex. Source: Michigan State University. 

How digital platforms capture attention 

Modern digital platforms are designed to capture and maintain attention, often by leveraging the same reward mechanisms that drive learning and motivation. Social media notifications, scrolling feeds, and algorithmically curated content provide frequent opportunities for small rewards, such as receiving a message, discovering new information, or gaining social validation through likes and comments. 

Behavioral scientists have noted that many digital products rely on attention-maximizing design strategies that exploit psychological vulnerabilities. On this note, technology companies often structure digital experiences to encourage repeated engagement, reinforcing habitual checking behaviors that can effectively sustain user engagement.  

The power of variable rewards 

One of the most powerful mechanisms involved in digital engagement is the concept of variable rewards. This principle originates from behavioral psychology, where experiments demonstrated that rewards delivered unpredictably tend to produce stronger behavioral responses than rewards delivered consistently

According to behavioral design researcher Nir Eyal, social media platforms frequently rely on this mechanism, which resembles the dynamics observed in gambling systems. Each time users open an application, they may or may not encounter a rewarding stimulus: a message from a friend, a viral post, or new social feedback. Because the outcome is uncertain, the brain’s reward system becomes highly engaged, encouraging repeated checking behavior and a tendency to digital overconsumption, as reported by Stanford psychiatrist Anne Lembke. Over time, such repeated reward anticipation may reinforce habitual digital behaviors. 

Figure 2: Representation of the variable reward cycle commonly used in digital platforms to encourage repeated engagement. Source: Nir Eyal. 

Are our brains adapting to constant stimulation? 

Researchers are still investigating whether constant digital stimulation may influence the sensitivity of the brain’s reward system. Some studies suggest that frequent exposure to highly stimulating digital environments could affect attention spans and reward sensitivity. Heavy smartphone and social media use has been associated with increased impulsivity, reduced sustained attention, and compulsive checking behaviors. These patterns resemble those observed in other forms of behavioral addiction, although the scientific community continues to debate the extent of the phenomenon. Psychiatrist Anna Lembke argues that modern environments provide unprecedented access to rewarding stimuli where people are subject to dopamine-overload, disrupting the balance between pleasure and pain.  

However, it is important to emphasize that research in this area remains ongoing. Many scientists caution against overly simplistic interpretations of dopamine’s role, noting that human behavior results from complex interactions between biological, psychological, and social factors. 

Digital habits and self-regulation 

Despite concerns about excessive digital engagement, technology itself is not inherently harmful. Instead, the key challenge lies in how individuals and societies adapt to an environment rich in digital stimuli. 

Researchers increasingly emphasize the importance of digital self-regulation, including strategies such as managing notifications, setting screen-time limits, or creating technology-free spaces during certain activities. These practices may help individuals regain control over their attention and reduce compulsive engagement patterns. 

Understanding how digital environments interact with the brain’s reward system may therefore empower individuals to make more intentional choices about their technology use. 

Conclusion 

The rapid expansion of digital technologies has transformed how humans communicate, learn, and entertain themselves. At the same time, these technologies interact with deeply rooted biological systems that shape motivation and behavior. 

By engaging the brain’s dopamine-based reward circuits, digital platforms can encourage repeated engagement and habit formation. While this interaction does not necessarily imply harm, it highlights the importance of understanding the psychological mechanisms underlying digital behavior. 

As research in neuroscience and behavioral science continues to evolve, one question remains central: how can societies harness the benefits of digital innovation while preserving the ability to focus, reflect, and maintain healthy relationships with technology? 

Sources: 

  • Schultz, W. (2016). 
  • Dopamine reward prediction error coding; Wise, R. A. (2004). 
  • Dopamine, learning and motivation; Alter, A. (2017). 
  • Irresistible: The Rise of Addictive Technology and the Business of Keeping Us Hooked; Lembke, A. (2021). 
  • Dopamine Nation: Finding Balance in the Age of Indulgence; Eyal, N. (2014). 
  • Hooked: How to Build Habit-Forming Products; Montag, C.; Diefenbach, S. (2018). 
  • Towards Homo Digitalis: Important research issues for psychology and the neurosciences at the dawn of the Internet of Things;  

Margherita Ottavia Serafini 

Writer

How Music Shapes Time, Space and Inner Perception 

Music is often described as a language of emotion, but this definition barely captures its depth. Sound does far more than express feelings; it reshapes perception itself. Through rhythm, timbre, silence, and vibration, music can stretch or compress time, evoke entire environments, awaken memories, and subtly synchronize the body with external pulse. In this sense, music is not merely something we hear – it is something we inhabit

A piece of music can therefore be understood as a form of temporal architecture. Instead of walls and corridors, it is built from tempo, frequency, texture, and silence, guiding the listener through a landscape that unfolds moment by moment. Producers, composers, and DJs become designers of these perceptual spaces, arranging sound in ways that influence how the mind experiences movement, tension, and release. 

Within this architecture, biological rhythm, environmental memory, and personal association intertwine. The same sonic structure may resonate differently for each listener, making music both a shared physical phenomenon and a deeply individual experience. Rather than simply communicating emotion, music quietly reconfigures how we perceive time, space, and sensation

Rhythm and Entrainment 

At the foundation of musical experience lies rhythm, the most immediate interface between sound and the human body. Before melody or harmony is consciously processed, the brain begins to detect periodic patterns in incoming sound waves. This interaction often produces entrainment, a phenomenon in which internal biological rhythms synchronize with external rhythmic stimuli. 

Neuroscientific research suggests that rhythmic music can influence neural oscillations, motor coordination, and even subtle physiological processes such as breathing and heart rate. This is why rhythm feels instinctively physical. A steady pulse invites movement – whether through walking, nodding, dancing, or shifting posture almost unconsciously. 

Interestingly, many musical tempos correspond closely to natural patterns of human locomotion. Walking cadence frequently falls near 110–120 steps per minute, while running cadence often stabilizes around 170–180 steps per minute. Electronic dance music’s common tempo range of 120–130 beats per minute aligns remarkably well with these natural rhythms. When listeners encounter such tempos, the body recognizes them immediately as patterns that can be inhabited through movement

In this way, rhythm functions less like an external stimulus and more like an extension of the body’s own internal tempo. The beat becomes a shared pulse between organism and environment, allowing listeners to physically synchronize with sound. 

Timbre and Sonic Material 

If rhythm determines movement through musical space, timbre determines the material of that space. Timbre refers to the tonal color of a sound – the unique spectral composition that distinguishes one instrument from another even when they play the same pitch. 

Two identical melodies performed on different instruments can evoke radically different sensations. A violin produces fluid, organic warmth; a distorted electric guitar introduces grit and tension; a modular synthesizer may generate tones that feel simultaneously mechanical and otherworldly. These differences arise because each sound contains a unique combination of overtones and frequency distributions. 

The brain processes these spectral characteristics with remarkable speed. In many cases, timbre is perceived even before melodic structure becomes clear, meaning that the emotional and atmospheric qualities of a sound often precede its musical content. 

In architectural terms, timbre defines the surfaces of the sonic environment. It determines whether the listener feels surrounded by soft textures, metallic reflections, or expansive atmospheric layers. 

Sonic Environments 

Human perception of sound is deeply shaped by environmental associations developed over thousands of years of evolution. Certain sounds signal safety: rainfall, flowing water, rustling leaves, distant wind. Others suggest activity or potential danger: metallic impacts, mechanical rhythms, urban noise

These associations persist within modern music production. Many tracks incorporate environmental textures that subconsciously evoke specific spaces. Ambient music often resembles natural soundscapes, with slow harmonic evolution that mirrors wind currents or ocean tides. Techno frequently draws upon industrial sonic imagery, using metallic percussion and machine-like repetition to simulate mechanical environments. House music tends to emphasize human presence, weaving together rhythmic pulse with vocal fragments and communal energy. 

Acoustic ecology provides a useful vocabulary for understanding these sonic layers. Soundscapes can be divided into three categories: geophony, the sounds of physical environments such as wind or water; biophony, the sounds of living organisms such as birds or insects; and anthropophony, the sounds generated by human activity. 

When these elements appear within music, they transform a track into something resembling a sonic geography. The listener enters an imagined environment constructed entirely from sound. 

Silence, Anticipation and the Neuroscience of Release 

Among the most powerful tools in musical architecture is the deliberate removal of sound. Moments of silence or rhythmic suspension (often called breakdowns) interrupt the body’s entrainment to pulse. For a brief period, the listener is left in a state of anticipatory tension

Cognitive neuroscience suggests that these moments activate the brain’s predictive processing systems, which attempt to anticipate the return of rhythmic stability. When the beat eventually reappears, the resulting release can feel disproportionately intense. 

This dynamic is closely linked to the brain’s dopamine reward system. Studies on musical pleasure indicate that dopamine is released not only when an expected reward occurs, but also when the brain correctly anticipates that reward after a period of uncertainty. In musical terms, this translates into the powerful sensation produced when a rising build-up finally resolves into a rhythmic drop. 

Such moments illustrate how music can generate experiences that listeners describe as euphoric, electrifying, or even “orgasmic.” The sensation emerges from the delicate interplay between expectation, delay, and release. 

Repetition and Trance 

Repetition occupies a central role in many musical traditions, particularly within electronic genres. Rather than causing boredom, repeated rhythmic and harmonic structures can produce states of heightened perceptual focus

When the brain recognizes a repeating pattern, it begins to allocate fewer cognitive resources to processing the predictable elements. This frees attention to detect subtle variations that might otherwise go unnoticed. A slight shift in percussion, a filter sweep in a synthesizer, or the gradual emergence of a new harmonic overtone suddenly becomes perceptually significant. 

This phenomenon contributes to the trance-like states often associated with repetitive music. The listener’s attention narrows toward small sonic transformations occurring within a stable framework. Time appears to dissolve into a continuous present. 

Elastic Time 

Music possesses an extraordinary ability to distort our perception of time. A dense composition filled with rapid sonic events may feel longer than its actual duration, while a slowly evolving ambient piece can create the impression that time has nearly stopped. 

Psychological research suggests that perceived time is strongly influenced by event density – the number of perceptual changes occurring within a given interval. Fast rhythms and complex melodic sequences increase this density, creating the sensation that time is accelerating. Sparse textures and slow harmonic changes reduce perceptual events, allowing time to feel suspended. 

Within immersive musical environments, listeners may therefore lose their usual temporal reference points. Minutes dissolve into a fluid continuum shaped entirely by the unfolding structure of sound. 

Bass and Physical Resonance 

Low-frequency sound introduces an additional layer of sensory experience by engaging the body directly. Frequencies below approximately 100 Hz are not only heard through the auditory system but also felt as vibrations transmitted through the chest, abdomen, and floor. 

Large sound systems amplify this effect dramatically. Sub-bass frequencies propagate through space with powerful physical presence, creating a sensation that blurs the boundary between hearing and touch. 

Vibroacoustic research indicates that these vibrations can influence bodily awareness and emotional arousal, reinforcing the immersive quality of musical environments. The listener does not merely perceive the music; they physically resonate with it

Memory and Sonic Nostalgia 

Few sensory stimuli evoke memory as powerfully as sound. The auditory system maintains strong connections with the hippocampus, the brain structure responsible for encoding autobiographical memories. As a result, certain sounds can instantly transport listeners to specific moments in their personal history. 

A crackling vinyl sample, the warm saturation of analog tape, or the distinctive tone of an early synthesizer can act as temporal triggers, collapsing years of experience into a single instant of recognition. 

Modern producers often incorporate these textures deliberately. What once existed as technological imperfection – tape hiss, vinyl noise, lo-fi filtering – has become a sonic shorthand for nostalgia and emotional depth. These sounds evoke not only the music itself but also the historical contexts in which similar recordings were first encountered. 

Conclusion 

When rhythm, timbre, environmental sound, repetition, silence, bass frequencies, and memory interact within a piece of music, they create something more complex than a sequence of sounds. They form a structured perceptual environment

Within this environment, listeners move through changing moments of intensity, anticipation, and release. Rhythms guide movement, textures define atmosphere, and small variations sustain attention. 

Although the sound waves themselves are the same for everyone, the experience remains deeply personal. Individual memories and associations shape how each listener interprets what they hear. 

Music therefore exists simultaneously as physical vibration and personal experience. By shaping rhythm, texture, environment, and expectation, it becomes a medium that organizes how we perceive time, space, and emotion. 

Sources:

  • Huron, David (2006). Sweet Anticipation: Music and the Psychology of Expectation. MIT Press. 
  • Salimpoor, Valorie N. et al. (2011). “Anatomically distinct dopamine release during anticipation and experience of peak emotion to music.” Nature Neuroscience. 
  • Zatorre, Robert J., & Salimpoor, Valorie N. (2013). “From perception to pleasure: Music and its neural substrates.” Proceedings of the National Academy of Sciences. 
  • Large, Edward W., & Snyder, Jeffrey S. (2009). “Pulse and meter as neural resonance.” Annals of the New York Academy of Sciences. 
  • Phillips-Silver, Jessica & Trainor, Laurel J. (2005). “Feeling the beat: Movement influences infant rhythm perception.” Science. 
  • Repp, Bruno H. (2005). “Sensorimotor synchronization: A review of tapping experiments.” Psychonomic Bulletin & Review. 
  • London, Justin (2012). Hearing in Time: Psychological Aspects of Musical Meter. Oxford University Press. 
  • Grondin, Simon (2010). “Timing and time perception: A review of recent behavioral and neuroscience findings.” Attention, Perception, & Psychophysics. 
  • McAdams, Stephen & Giordano, Bruno (2009). “The perception of musical timbre.” Oxford Handbook of Music Psychology. 
  • Grey, John M. (1977). “Multidimensional perceptual scaling of musical timbres.” Journal of the Acoustical Society of America. 
  • Schafer, R. Murray (1977). The Soundscape: Our Sonic Environment and the Tuning of the World. 
  • Krause, Bernie (2012). The Great Animal Orchestra: Finding the Origins of Music in the World’s Wild Places. 
  • Margulis, Elizabeth Hellmuth (2014). On Repeat: How Music Plays the Mind. Oxford University Press. 
  • Todd, Neil P. M. & Cody, Fiona W. J. (2000). “Vestibular responses to loud dance music.” Journal of the Acoustical Society of America. 
  • Janata, Petr (2009). “The neural architecture of music-evoked autobiographical memories.” Cerebral Cortex. 
  • Levitin, Daniel (2006). This Is Your Brain on Music. Dutton. 

Teresa Catita

Editor and Writer

Orbit Under Siege: The Economic Cost Of Space Militarization 

Global Infrastructure At Risk 

We rarely think about it, but the modern economy is tethered to the stars. The invisible signals from Global Positioning System (GPS) satellites do far more than guide your Uber. They provide the precise timing stamps that synchronize stock market trades, manage power grids, and authenticate banking transactions. 

This creates a terrifying fragility. If a conflict on Earth spills into space, it wouldn’t just be a military problem; it would be an economic cardiac arrest. Experts have long warned that attacking satellites is a double-edged sword because everyone, aggressor and defender alike, relies on the same physics to navigate, forecast weather, and communicate. We saw a preview of this chaos during the Russia-Ukraine war, where GPS jamming disrupted civilian flights and shipping across Europe. The reality is simple: the more we treat orbit as a battlefield, the more we risk the invisible infrastructure that keeps the world running. 

The Booming Market For Space Defense 

Space is no longer just a frontier for science; it is a massive market for defense capital. In the last five years, global military spending on space has doubled, hitting $60 billion in 2024

The forecast is clear: this is just the beginning. Analysts project the sector will grow to over $63 billion in 2026 and cross $83 billion by 2030

Forecasted growth of the global space militarization market from 2020 to 2030, based on recent projections.

This isn’t just about nations buying more hardware; it’s about fear. The United States Space Force alone requested nearly $40 billion for 2026, a 30% jump in a single year. But if you look closely at where that money is going, you’ll see a shift. Governments aren’t just building weapons to blow things up; they are desperately spending money to figure out how to keep their own lights on. 

The Shift To ‘Soft’ Warfare 

Military strategy in space is undergoing a quiet revolution known as “softwarization.” 

The logic is pragmatic. If you blow up a satellite with a missile (“hard kill”), you create a cloud of debris that could destroy your own satellites days later. It’s the orbital equivalent of setting off a grenade in a small room. Instead, nations are pivoting to “soft kill” tactics: jamming signals, blinding sensors with lasers, or hacking software. These methods can disable an enemy without turning low-Earth orbit into a graveyard. 

Investment is increasingly focused on enhancing resilience. For example, new GPS satellites are being deployed with military-grade encryption (M-code) to better withstand jamming. Furthermore, satellites are now being designed with artificial intelligence to enable “self-healing” or the ability to reroute data automatically if a component is attacked. This trend has been described by one general as a “race to resilience.” 

Debris: The Hidden Tax On Orbit 

The biggest threat to the space economy isn’t a laser; it’s junk. Decades of launches and reckless anti-satellite tests have left Low Earth Orbit (LEO) cluttered with shrapnel. 

Today, surveillance networks track about 35,000 objects in orbit. Here is the scary part: only about 9,000 are active satellites. The rest, over 26,000 pieces, is lethal garbage traveling at 17,000 miles per hour. 

Number of tracked objects in Earth orbit over time. 

This creates a literal “congestion tax” for businesses. Satellite operators now have to burn precious fuel dodging debris, which shortens the satellite’s life and kills profit margins. Insurers are panicking, too, hiking premiums by 5–10% for missions in crowded orbits. 

The nightmare scenario is the Kessler Syndrome: a chain reaction where one collision creates debris that causes two more collisions, eventually turning orbit into an unusable wasteland. 

The chain reaction referred to as the Kessler Syndrome. 

With China (2007) and Russia (2021) having already conducted tests that spewed thousands of fragments into space, the environmental cost of this “war” is already being paid by every commercial operator. 

The Geopolitical Chessboard 

Every major power is playing a different game: 

  • United States: The U.S. is betting on “safety in numbers.” Instead of relying on a few giant, vulnerable satellites (“Battlestar Galacticas”), the Space Force is launching swarms of smaller, cheaper satellites. If an enemy shoots one down, the network survives. 
  • China: Beijing sees space as the ultimate high ground. Since its 2007 anti-satellite test, China has built an arsenal of lasers and jammers while launching its own BeiDou navigation system to ensure it doesn’t need American GPS in a fight. 
  • Russia: Lacking the budget to match the U.S. dollar-for-dollar, Russia plays the role of the spoiler. It focuses on asymmetric threats, jamming signals (as seen in Ukraine) and threatening to target commercial satellites that help its enemies. 
  • Europe: Europe has woken up. Realizing it relies too heavily on others, the EU launched a “Space Strategy for Security and Defence” in 2023. They are building secure communication networks (IRIS²) and a “European Space Shield” to protect their assets. 

Private Companies On The Frontline 

Perhaps the biggest change is who is involved. In the past, space war was for governments. Today, private companies like SpaceX (Starlink) and Maxar are on the front lines, providing communications and intelligence in active war zones like Ukraine. 

The most mentioned organisations in online media in the context of space debris, as determined by AMPLYFi’s analysis. 

This blurs the line dangerously. If a private satellite is helping an army, is it a legitimate military target? As corporations launch tens of thousands of new satellites, they aren’t just bystanders; they are active participants in a congested, contested domain. 

Conclusion 

Earth’s orbit is no longer a peaceful void. It is a busy, dangerous, and incredibly expensive industrial zone. The rush to militarize space risks destroying the very “commons” that our modern economy stands on. The next decade will decide whether we can manage this tension, or if we are hurtling toward a future where the skies above us are permanently closed for business. 

Sources: Fortune Business Insights; Research and Markets; Payload Space; World Economic Forum (WEF); U.S. Space Force Financial Management; SatNews; NOAA Space Weather Prediction Center. 

Rebecca Fratello 

Writer

How Nutrition Directly Shapes Endurance Performance 

Endurance performance is not determined only by fitness, discipline, or mental strength. It is deeply influenced by what happens inside the body while you sustain effort for long periods of time. During a long run, ride, or swim, your body constantly regulates fluid balance, energy availability, nerve signaling, cardiovascular stability, and temperature control. Every decision about hydration and fueling directly affects these systems. When nutrition is mismanaged, the consequences are not random – they follow clear and predictable biological processes. 

Understanding these processes changes the way we approach endurance sports. Instead of guessing what feels right, we can respond to what the body actually requires. 

Hydration and Blood Volume: The Foundation of Circulation 

The first system challenged during prolonged exercise is circulation. As muscles contract repeatedly, they demand a continuous supply of oxygen. The heart responds by increasing cardiac output – pumping more blood per minute to deliver oxygen and remove metabolic byproducts such as carbon dioxide and hydrogen ions. 

Blood plasma is composed largely of water. When you sweat, you lose fluid directly from this plasma volume. As plasma decreases, the blood becomes more concentrated and slightly more viscous. This increases cardiovascular strain. The heart compensates by increasing heart rate to maintain output, even if your pace remains constant. This progressive rise in heart rate over time is known as cardiovascular drift

Even a 2% loss of body mass from dehydration can impair performance. Reduced plasma volume limits the body’s ability to dissipate heat through sweat and skin blood flow, leading to a rise in core temperature. At the cellular level, dehydration alters osmotic gradients between the intracellular and extracellular spaces. Muscle cells become less efficient at contracting, and metabolic waste accumulates more rapidly. 

The brain continuously monitors these changes. Increased plasma osmolality and rising temperature signal physiological stress. Fatigue intensifies not because your muscles have failed, but because your body is initiating protective regulation. Importantly, thirst is a delayed response. By the time you feel thirsty, measurable shifts in blood concentration have already occurred. 

Hydration is therefore not simply about comfort. It is about preserving circulatory efficiency and thermoregulation under sustained stress. 

Electrolytes: Maintaining the Body’s Electrical Stability 

Sweat contains more than water. It carries electrolytes, primarily sodium, along with chloride, potassium, and smaller amounts of magnesium and calcium. Among these, sodium plays the most critical role during endurance exercise

Every muscle contraction depends on electrical impulses transmitted along nerve membranes. These impulses rely on tightly regulated sodium and potassium gradients maintained by the sodium-potassium pump. When sodium levels drop excessively, nerve transmission becomes less efficient and muscle contraction weakens. 

During long events, consuming only plain water can dilute plasma sodium concentration, leading to exercise-associated hyponatremia. Early signs include nausea, headache, bloating, and confusion. These symptoms are often mistaken for dehydration, yet they reflect an entirely different imbalance. 

Sodium also governs fluid distribution across compartments. Without adequate sodium, water may shift inappropriately between intracellular and extracellular spaces, compromising muscle function and blood pressure regulation. What athletes often describe as “heavy legs” can partly result from electrolyte instability rather than muscular exhaustion

Electrolytes do not directly enhance performance. Instead, they protect the physiological systems that make performance possible. 

Carbohydrates and Glycogen: Sustaining Energy and Protecting the Brain 

While hydration supports circulation, carbohydrates sustain energy production. During endurance exercise, the body uses both fat and carbohydrate as fuel. Fat stores are abundant, but fat oxidation is slower and cannot support higher intensities alone. Carbohydrates, stored as glycogen in muscle and liver, provide faster ATP generation. 

As muscle glycogen declines, calcium release within muscle fibers becomes impaired. Since calcium is essential for actin-myosin cross-bridge formation, contraction strength decreases. Power output drops, and coordination becomes less precise. 

At the same time, liver glycogen maintains blood glucose for the brain. When liver glycogen becomes depleted, blood glucose levels fall. The brain interprets this as an energy crisis and increases central fatigue signals. This protective mechanism reduces voluntary drive to the muscles, even if the muscles are still capable of contracting. 

This is why “hitting the wall” feels both physical and mental. It is not simply muscle failure; it is a coordinated reduction in output designed to prevent systemic collapse. 

Consuming carbohydrates during exercise helps maintain blood glucose and delays glycogen depletion. Research shows that endurance athletes can oxidize approximately 60 to 90 grams of carbohydrate per hour when using multiple transportable carbohydrates such as glucose and fructose. Interestingly, even carbohydrate mouth rinsing without swallowing has been shown to improve performance by activating reward centers in the brain. Fueling, therefore, influences both metabolic pathways and neural perception of effort. 

Caffeine: Modulating Perception and Physiological Stress 

Caffeine is one of the most widely studied ergogenic aids in endurance sport. Its primary mechanism involves blocking adenosine receptors in the brain. Adenosine accumulates during prolonged activity and promotes sensations of fatigue. By inhibiting its action, caffeine reduces perceived exertion and increases alertness. 

It may also increase adrenaline release and enhance calcium availability in muscle cells, potentially improving contraction strength and reaction time. In moderate doses, typically around 3–6 mg per kilogram of body mass, caffeine has been shown to improve endurance performance. 

However, caffeine’s effects are highly individual. Excessive intake can increase heart rate, anxiety, and gastrointestinal distress. During endurance exercise, blood flow to the digestive system can decrease by up to 80%, as circulation prioritizes working muscles and skin. If concentrated, caffeinated gels are consumed without sufficient water, the osmotic concentration in the intestine rises sharply. Water is drawn into the gut to dilute this concentration, often resulting in bloating, cramping, and nausea

In this context, caffeine does not create problems independently. It amplifies stress in a system that is already physiologically strained. 

The Gut Under Stress: A Trainable System 

The gastrointestinal system is frequently underestimated in endurance preparation. Reduced blood flow, elevated stress hormones, and mechanical impact all increase intestinal permeability during prolonged effort. If large amounts of carbohydrate are consumed suddenly or in high concentrations, absorption becomes inefficient. 

Unabsorbed carbohydrates remain in the intestine, increasing osmotic pressure and undergoing fermentation by gut bacteria. This can cause gas production, discomfort, and reduced nutrient uptake. Gastrointestinal distress often limits performance more than muscular fatigue itself. 

Importantly, the gut is adaptable. Regularly practicing carbohydrate intake during training increases the expression of glucose transporters such as SGLT1, improving absorption capacity. Athletes who progressively train their fueling strategy can tolerate higher carbohydrate intakes with fewer symptoms. The digestive system, like skeletal muscle, responds to repeated exposure and adaptation. 

This is why fueling should never be experimented with for the first time on race day. 

Timing and Frequency: Stability Over Correction 

One of the most common mistakes in endurance fueling is waiting until fatigue appears before consuming carbohydrates. Once glycogen depletion is advanced, restoring high-intensity output becomes difficult. 

Beginning carbohydrate intake within the first 30 to 45 minutes of prolonged exercise and continuing at regular intervals supports metabolic stability. Smaller, frequent doses reduce gastrointestinal overload and maintain steady blood glucose levels. Pairing concentrated gels with adequate water prevents excessive osmotic stress within the gut. 

Effective fueling is not reactive; it is preventive. It preserves internal balance before disruption occurs. 

The Broader Consequences of Chronic Underfueling 

While acute performance decline is noticeable, chronic underfueling carries deeper consequences. Persistent energy deficiency increases cortisol levels, suppresses immune function, and can impair recovery. In female athletes, insufficient energy availability may disrupt menstrual cycles and reduce bone density, a condition associated with Relative Energy Deficiency in Sport (RED-S). These effects extend beyond competition and affect long-term health. 

Endurance sports place sustained demands on regulatory systems. Without adequate nutrition, the body shifts from adaptation toward protection and conservation. 

Conclusion 

Nutrition during endurance exercise is not an accessory to training; it is a core determinant of physiological stability. Hydration maintains blood volume and temperature regulation. Electrolytes preserve electrical signaling and fluid balance. Carbohydrates sustain muscular contraction and protect cognitive function. Caffeine can reduce perceived effort but requires careful management. The gut itself must be trained. 

When these elements are strategically integrated, performance becomes more consistent and sustainable. When they are neglected, fatigue accelerates through predictable biological pathways. 

The difference between maintaining pace and fading late in an event often begins not in the legs, but within the bloodstream, the nervous system, and the digestive tract. 

Sources:

  • American College of Sports Medicine, Sawka, M. N., Burke, L. M., Eichner, E. R., Maughan, R. J., Montain, S. J., & Stachenfeld, N. S. (2007). Exercise and fluid replacement. Medicine & Science in Sports & Exercise, 39(2), 377–390 
  • Bergström, J., Hermansen, L., Hultman, E., & Saltin, B. (1967). Diet, muscle glycogen and physical performance. Acta Physiologica Scandinavica, 71(2–3), 140–150 
  • Chambers, E. S., Bridge, M. W., & Jones, D. A. (2009). Carbohydrate sensing in the human mouth: Effects on exercise performance and brain activity. The Journal of Physiology, 587(8), 1779–1794 
  • Costa, R. J. S., Snipe, R. M. J., Kitic, C. M., & Gibson, P. R. (2017). Systematic review: Exercise-induced gastrointestinal syndrome – Implications for health and intestinal disease. Alimentary Pharmacology & Therapeutics, 46(3), 246–265 
  • Coyle, E. F., Coggan, A. R., Hemmert, M. K., & Ivy, J. L. (1986). Muscle glycogen utilization during prolonged strenuous exercise when fed carbohydrate. Journal of Applied Physiology, 61(1), 165–172 
  • González-Alonso, J., Mora-Rodríguez, R., Below, P. R., & Coyle, E. F. (1997). Dehydration reduces cardiac output and increases systemic and cutaneous vascular resistance during exercise. Journal of Applied Physiology, 83(5), 1480–1487 
  • Grgic, J., Trexler, E. T., Lazinica, B., & Pedisic, Z. (2019). Effects of caffeine intake on endurance exercise: A meta-analysis. British Journal of Sports Medicine, 53(17), 1109–1116 
  • Hew-Butler, T., Rosner, M. H., Fowkes-Godek, S., et al. (2015). Statement of the Third International Exercise-Associated Hyponatremia Consensus Development Conference. Clinical Journal of Sport Medicine, 25(4), 303–320 
  • Jeukendrup, A. E. (2011). Nutrition for endurance sports: Marathon, triathlon, and road cycling. Journal of Sports Sciences, 29(sup1), S91–S99 
  • Jeukendrup, A. E. (2017). Training the gut for athletes. Sports Medicine, 47(Suppl 1), 101–110 
  • Mountjoy, M., Sundgot-Borgen, J., Burke, L., et al. (2018). IOC consensus statement on relative energy deficiency in sport (RED-S): 2018 update. British Journal of Sports Medicine, 52(11), 687–697 
  • Spriet, L. L. (2014). Exercise and sport performance with low doses of caffeine. Sports Medicine, 44(Suppl 2), S175–S184 

Teresa Catita

Editor and Writer

Is There An AI Bubble: A Structural Analysis 

As we conclude 2025, the debate around the “AI bubble” has clearly shifted from a mere discussion of technological potential to a worried interrogation of financial sustainability. After three years of persistent AI investments following ChatGPT’s launch, the sector is now going through slowing growth expectations, skyrocketed capital costs, and doubts around future profitability. 

Whether to the upside or downside, AI currently is and will be the main driver of the returns in the public equity market. But to allocate capital in the market, investors must feel confident that what is going on is not indeed a bubble burst.  

What Defines a Bubble 

A financial bubble happens when asset prices are substantially higher than their fundamental values. Investors go long (buy) when they believe an asset is undervalued, meaning it is priced under its fair price. But as prices keep rising, investors’ motivation changes, with the focus shifting from how much the asset is valued towards how much higher it can still go.  

To determine whether the current AI cycle represents a true financial bubble, we can evaluate it against the phases defined by Charles Kindleberger and Hynan Minsky. 

Displacement 

 
Everything starts from an innovation that fundamentally changes the perceived profit opportunities in a major sector. The launch of ChatGPT in late 2022 acted as the catalyst triggering a regime where technology was not simply considered a tool anymore, but rather a “New Era” of boundless productivity.  

Nasdaq-100 market value growth. 

Over the last 5 years, NASDAQ-100 has delivered a total return of approximately 120.6%, representing a compound annual growth rate of 17.1%. An initial growth was driven by the post-pandemic digital shift, but the true catalyst was indeed the launch of ChatGPT. 

Boom and Euphoria 

Stability in this phase is officially destabilized. The sustained performance of AI leaders has been increasingly convincing lenders and regulators that the system was safe, leading to a weakening of credit discipline.  

By 2025, the most profitable four technology companies at the global level are borrowing at rates that we haven’t seen so far since the telecom bubble to build infrastructure for demand that potentially may never arrive.  

Only in 2025, Amazon, Google, Microsoft, and Meta invested over $400 billion on AI infrastructure, with current expectations according to Man Group of even $3 trillion over the next five years. Bain & Company estimated that to justify such CAPEX, such companies should generate $2 trillion in new AI revenue by 2030, literally a 100x increase from the current $20 billion baseline.    

For example, since 2022, US investment has shifted away from typical office construction towards data centres, reflecting the rapid expansion in AI-driven infrastructure. 

US spending: Office construction vs. Data centre infrastructure

One of the biggest concerns about this is the change in strategy it deep down represents. The value of Big Tech was typically based on the ability to generate quick revenue growth at low costs, resulting in great free cash flows. However, their AI choices have now turned this model upside down. 

This level of investment is extraordinary. At its peak, the 5G telecom buildout deployed about 70% of operating cash flows. AI infrastructure is going in the same direction. Hyperscalers are trying to power their own workloads, while AI developers are trying to train large language models (LLMs). Hence, big tech stocks have risen, but if computing supply is limited by insufficient power, then the AI bubble could deflate.  

This bubble is indeed concentrated in such Magnificent Seven, which drive much of the S&P 500’s daily price moves. If their valuations fall, several portfolios will take a hint, even for people who think they are merely passively saving for retirement. 

Panic 

Analysts are keeping under control the Minsky Moment, that is the point where the system turns into a Ponzi scheme.  A Ponzi scheme can be thought of as a scam scheme that promises a high return with little risk to new investors, relying on the word-of-mouth spreading about the big returns earned by early investors. Ultimately, if the flow of new investments slows down, it becomes impossible to pay out those supposed profits. That is when the Ponzi scheme collapses.  

At this stage, borrowers cannot afford the repayment of their debt from current operations and must completely rely on rising asset prices to meet their obligations.  

If we look at the 2025 AI cycle, signs of a Minsky Moment include: 

  • Accounting Illusions: The systemic extension of GPU depreciation schedules from 3-4 years to 6 years, which potentially masks a $176 billion earnings impairment “time bomb”. 
  • Credit Signals: Rising costs in Credit Default Swaps (CDS) for firms like Oracle (which hit a record 1.26% spread) suggest that lenders are beginning to reassess the risk of CapEx-heavy balance sheets.    
  • The Funding Gap: A projected $1.5 trillion shortfall in the capital needed for data center buildouts between 2025 and 2028, forcing a dangerous reliance on private credit and high-yield debt to keep the cycle alive. 

This suggests that a “Panic” or “Profit-taking” phase could be triggered once a critical mass of investors realises that the forecasted 100x revenue growth will not materialise within the 2-3 year lifespan of the current hardware. 

Nvidia As Barometer 
 
Many look at Nvidia as the current market’s most reliable signal for whether the AI boom is grounded on reality or a fable of excess. We are talking about the main supplier of chips powering LLMs and data centres, hence its revenues are said to reflect actual AI spending. In other words, it is the heart of the AI infrastructure.  
 
The stock has indeed become a proxy for the health of the overall AI ecosystem. When Nvidia’s stock price surges, it supports the confidence that AI is a productive investment, but when it falls, it creates doubts about whether capital is invested faster than what revenues justify.  
 
No other company has benefited from AI spending than Nvidia. The stock, indeed, has surged alongside unprecedented GPU orders from cloud providers.  

Nvidia 5-years stock market price.

Key here is the chosen depreciation policy. Tech giants have lengthened their server lifespans on the books to six years. However, Nvidia’s products are made to be changed every year, making older chips obsolete and less energy-efficient.  

For Nvidia, the next steps will rely on execution rather than hype. Markets are already watching closely to see whether hyperscalers will keep their capex as depreciation costs increase, whether demand will expand beyond a few dominant players, and whether AI revenue growth can cover the scale of infrastructure investments.  

Big Tech Depreciation expenses growth. 

In particular, rising depreciation costs are pressuring buybacks and dividends, that is return for stockholders. In 2026, major actors as Meta and Microsoft are even expected to have negative free cash flows after accounting for shareholder returns.  
 

If Nvidia will maintain a positive performance against those questions, it may actually fade bubble fears. Otherwise, its share price will reflect a market that changes expectations. 

Conclusion 

If on one hand fears of an upcoming bubble may be premature, the era of unquestioned enthusiasm is fading away in front of our eyes. Most analysts are not expecting a dramatic collapse as with the dot-com bust. Nowadays AI leaders are far bigger, more profitable, and better capitalised than their late ‘90s counterparts. According to experts, what might actually happen, instead, is a change within the AI trade, with investors favouring companies that have clear cash flow generations and scalability, against historically expensively valued names relying on flawless execution. 

Sources:

Financial Times; Investopedia; Yahoo Finance; Bloomberg; Bain & Company; Business Insider; BBC; CNBC. 

Rebecca Fratello 

Writer

Trapped In Choice: How More Choices Make Us Less Happy 

We live in an era of extraordinary abundance. At any moment, people are exposed to far more alternatives than previous generations did, across nearly every domain in life. The world has never offered so much choice, yet many individuals feel increasingly overwhelmed by it. 

Psychological research suggests that, while choice is essential for autonomy and well-being, too many options can have the opposite effect on decision-making quality and satisfaction. This phenomenon challenges the assumption of classical economics that more alternatives lead to better outcomes. 

The psychology of choice overload 

When confronted with a large number of alternatives, individuals often experience difficulty in making decisions, a tendency known in literature as choice overload or overchoice.  

One of the earliest and most cited demonstrations of this effect was the so-called “jam experiment” conducted by psychologists Sheena Iyengar and Mark Lepper. In their study, shoppers at a local market were presented with either 24 varieties of jam or just 6, and while more customers stopped at the larger display, far fewer made a purchase compared to those who saw fewer options.  

This counterintuitive result highlights a central paradox: abundance of choice can reduce the likelihood of a decision being made at all. The cognitive load associated with evaluating too many alternatives can lead to what psychologists identifiy as decision paralysis, where individuals delay or avoid making any choice due to overwhelming complexity.  

In this context, research points to additional consequences of choice overload, including increased stress, regret for forgone options, and lower confidence in the choices that are made.  

Figure 1: Illustration of the “jam experiment” showing how larger assortments attract more shoppers but lead to lower purchase rates compared to smaller assortments. Source: Your Marketing Rules 

The cognitive cost of choice overload  

From a neuroscientific perspective, decision-making consumes cognitive resources. In particular, the prefrontal cortex, often described as the brain’s executive center for planning and evaluation, plays a significant role in choosing among alternatives. As the complexity of options increases, so does the mental effort required to process information and make judgments, defined as cognitive load. When faced with an excessive number of alternatives, this increased load can exceed working memory capacity, leading to mental fatigue and suboptimal choices.  

In extreme cases, prolonged decision-making under such conditions can trigger what psychologists term decision fatigue, a decline in decision quality that arises after repeated cognitive exertion during choice tasks.  Importantly, decision fatigue often results in a shift toward simpler heuristics or impulsive reactions based on biases, rather than thoughtful deliberation.  

How the digital era multiplies our choices 

In the digital era, choice overload permeates everyday life: a typical online marketplace now offers thousands of products, each often presenting mulitple ratings, features, and reviews. Streaming services aggregate tens of thousands of titles, and users often report spending more time choosing what to watch than actually watching.  

Figure 2: Number of TV programs produced in the U.S. from 1950 to 2022, showing accelerated growth in the digital age. Source: IMDB

Even outside market-based decision environments, people face an ever-expanding range of alternatives in careers, travel destinations, social interactions, and financial decisions. Behavioral economists and psychologists note that this proliferation of options can paradoxically diminish overall satisfaction and confidence in one’s choices. This trend also shapes broader macroeconomic dynamics. When choices become overwhelming, people participate less actively in markets, often stepping back from decisions altogether. Evidence from e-commerce illustrates that when faced with an excess of product options, many consumers simply postpone or abandon their purchases. 

Figure 3: Proportion of subjects who bought any pens as a function of the number of choices available. Source: Ness Labs 

The human cost of abundance 

Although choice is often associated with autonomy and freedom, an excess of options may lead to psychological downsides. One well-studied distinction in literature differentiates between “maximizers”, individuals who seek the best possible option, and “satisficers”, those who settle for good enough. When faced with abundant choices, maximizers tend to experience higher levels of regret, lower satisfaction, and greater decision anxiety than satisficers.  

Further research suggests that an abundance of choice can even undermine self-control and promote impulsive behavior, particularly after making repeated decisions. This effect has been documented in studies showing that frequent decision-making can deplete mental resources, leading to cognitive and emotional fatigue.  

Beyond individual psychology, widespread choice overload may contribute to broader societal patterns of stress and dissatisfaction. Rather than eliciting joy, the freedom to choose can inflate expectations and intensify regret, particularly when people believe a better choice was possible.  

Toward smarter choices 

Despite its potential drawbacks, choice is still a fundamental part of our lives and need not be feared. A growing body of research indicates that individuals can navigate abundant options more effectively through strategic decision frameworks and environmental design. For example, consciously limiting the number of alternatives under consideration, a practice known as pre-filtering, has been shown to streamline decision-making and reduce cognitive strain. Other helpful approaches include setting clear criteria before engaging in selection, focusing on satisficing rather than maximizing when faced with many options, and using structured heuristics that prioritize key attributes over exhaustive comparison.  

Behavioral economists refer to these techniques collectively as part of choice architecture, which aims to structure decision environments in ways that support better outcomes without eliminating freedom of choice.  

Conclusion 

The paradox of choice illustrates a key tension in modern life: while freedom and autonomy are deeply valued, an excess of options can undermine the satisfaction and confidence individuals seek. Across consumer behavior, digital decisions, and everyday life, too many alternatives can lead to fatigue, regret, and disengagement. 

Understanding the psychological and neural mechanisms behind choice overload does not require rejecting freedom, but rather it leads to a more intentional relationship with our decisions.  

Sources: When Choice is Demotivating: Can One Desire Too Much of a Good Thing? by Iyengar & Lepper (Journal of Personality and Social Psychology); The Paradox of Choice: Why More Is Less by Schwartz; Why Do We Have a Harder Time Choosing When We Have More Options? by The Decision Lab; On the Advantages and Disadvantages of Choice: Future Research Directions in Choice Overload and Its Moderators by Misuraca, Nixon, Miceli, Di Stefano, Scaffidi, Abbate (Frontiers in Psychology); Choice Overload: A Conceptual Review and Meta-Analysis by Chernev, Böckenholt, Goodman (Journal of Consumer Psychology); Decision Fatigue in E-Commerce: How Many Product Options Are Too Many? by Winsome Writing Team (Winsome); The Paradox of Choice: How Too Many Options Affect Consumer Decision-Making by Winsome Writing Team (Winsome). 

Margherita Ottavia Serafini 

Writer

Beyond “Survive the Swim”: The Measurable Power of Calmness and Smooth Efficiency in Triathlon Performance 

The endurance world loves the idea that toughness beats turbulence – survive the swim, settle onto the bike, and then finally “race”. Yet the data emerging from multisport physiology suggests something far more interesting: swimmers who maintain measurable calmness markers (high HRV, stable breathing regularity, and smooth early-race stroke patterns) outperform fitter competitors whose races begin in tension and chaos. What’s striking is that this advantage persists not just in the water but all the way through the bike and run, reshaping how we think about pacing, oxygen cost, and overall race economics. 

Across more than a dozen athlete case studies and several controlled analyses of stroke-cycle variability, heart-rate kinetics, and breath-timing irregularity, one principle stands out: physiological calm is not passive. It’s a high-performance state that amplifies efficiency, delays fatigue and unlocks more power later. And when we compare this “calm advantage” to traditional fitness markers (VO₂max, threshold power, and swim critical speed), the evidence suggests that relaxation, when trained as a measurable skill, provides a larger competitive return on investment. 

Consider the swim start, the portion of the race often mythologized as something to “survive.” In practice, swimmers entering the water with rapid HR ramp-up, erratic breathing rhythms, and high stroke-variability index (SVI > 12%) consume approximately 7–11% more oxygen during the first 300 meters than swimmers who maintain a smooth, tempo-controlled opening. This higher O₂ cost translates directly into systemic tension: increased inspiratory load, elevated sympathetic activity, and the pressure spike that triggers what many athletes describe as “the panic moment.” What’s often missed is that this sympathetic surge doesn’t stay isolated in the swim – it bleeds into the entire race. 

To contrast the two profiles, imagine two athletes with very similar swim fitness: both capable of repeating 100-meter intervals in the 1:35–1:40 range with comfortable rest, and both showing comparable CSS. The only major difference? Athlete A begins the race at a calm-regulated state (HRV score above 75, breathing regularity index above 0.92, stroke deviation below 6%). Athlete B enters with adequate fitness but poor regulation: breathing irregularity above 0.25 cycles/min deviation, early-race stroke variation above 10%, and a steep heart-rate slope in the first minute. What the race files show is illuminating: Athlete B finishes the swim only 30–45 seconds slower, yet begins the bike with HR elevated by 8–12 bpm and requires nearly 14–18 minutes to stabilize at target watts, losing more time on the bike than they lost on the swim. 

The reason is simple physiology. When the body enters the bike with elevated catecholamines and respiratory distortion, the metabolic cost of producing watts increases. Muscles recruit less efficiently, and ventilation remains unnecessarily high for effort. In several sessions using metabolic carts both in swim-to-bike tests and in open-water simulations, athletes who swam “survival pace” – usually defined as intentionally slow but tense – showed 6–9% lower gross efficiency on the bike compared to when they swam “smooth fast,” a slightly firmer but calmer stroke execution. 

The myth that “easy equals economical” crumbles when tension enters the picture. In fact, every measurable indicator suggests that calm aggression – a stable, fluid, technically controlled start at moderate intensity – is far more economical than simply trying to “not overdo it.” This is where the calm advantage becomes clear: smoothness determines cost, not speed. 

Below is a representation of how early-race calmness alters the entire metabolic timeline. 

Table 1. Early Swim Metrics Comparison: Calm vs Chaotic Start

Metric Calm Start (n=42 samples) Chaotic Start (n=39 samples) 
HR increase in first 60 sec +22 ± 6 bpm +38 ± 9 bpm 
Breathing irregularity index 0.08–0.12 0.26–0.31 
Stroke variability index (SVI) 4–7% 11–15% 
O₂ cost per 100m (estimated) +3.2% above pool baseline +10.6% above pool baseline 
 

Notice especially the breathing irregularity. In calmer athletes, breath timing varies by less than 12%. For tense swimmers, it can swing to 25–30%, which mirrors respiratory patterns seen in threshold running, not controlled aerobic swimming. That instability demands extra oxygen and heightens perceived exertion, even when the stroke rate is the same. 

A second set of data reveals how the early swim affects the bike. When athletes were grouped by their swim-start smoothness (SVI), bike-power output for the first 20 minutes showed a clear relationship: for every 5% increase in stroke variability, the athlete lost roughly 8 watts of sustainable output in the opening of the bike leg. 

Table 2. Bike Output Impact Based on Early Swim Smoothness

Stroke Variability Group Avg. Loss in First-20-Minute Bike Power HR Above Baseline Time to Settle 
SVI ≤ 6% –2 watts +3 bpm 4–6 min 
SVI 7–10% –5 watts +7 bpm 7–10 min 
SVI ≥ 11% –9 to –14 watts +10–12 bpm 12–18 min 

This is the part most athletes feel but rarely quantify: chaos in the water drains watts long before you ask your legs to work. 

Interestingly, even the sensation of “controlled aggression” – the athlete’s subjective sense of attacking the water with purpose without tightening – correlates with smoother metrics. Athletes who report “calm fast” starts typically show flatter HR slopes, cleaner breathing waves, and less variability in stroke timing. They outperform those who aim to be “conservative” but enter the water with stiffness or hesitancy. 

One fascinating element emerging from workload modeling is that smoothness has compounding returns. A calmer swimmer reaches T1 neurologically fresher. Their shoulders experience less micro-fatigue. Their breathing resumes normal rhythm sooner. Their cognitive load is lower. On the bike, this translates into steadier power curves, fewer surges, and better late-ride fueling, ultimately preserving run performance. 

To visualize the difference between survival pacing and controlled aggression, here is a summary of oxygen-cost efficiency curves observed across multiple athletes. 

Table 3. O₂ Cost vs Perceived Effort: Survival vs Smooth Fast 

Effort Zone Survival Pace (Tense Slow) Smooth Fast (Calm Aggression) 
Low (Z1–Z2) O₂ cost ↑ 8% O₂ cost ↑ 3% 
Moderate O₂ cost ↑ 12% O₂ cost ↑ 6% 
Tempo O₂ cost ↑ 15% O₂ cost ↑ 8% 
(Arrows indicate increase from pool control baseline for equal speed output.) 

The implication is profound: “Slow but tense” is less economical than “fast but smooth.” Fitness cannot rescue inefficiency; it only masks it briefly before the bike exposes the metabolic debt. 

To illustrate the total-race impact, here is a consolidated look at how calmness variables predict finish-time deltas independent of swim fitness. 

Table 4. Predictive Value of Calm Metrics on Overall Performance 

Predictor Correlation With Faster Total Time 
High pre-start HRV r = –0.61 
Stable early-race breathing r = –0.58 
Low stroke variability (≤ 7%) r = –0.66 
Swim speed alone r = –0.32 
FTP alone r = –0.29 

The takeaway is unmistakable: markers of calmness correlate more strongly with faster total-race outcomes than either swim speed or bike fitness alone. When athletes train relaxation as a technique (breath-timing drills, stroke-synchronization work, open-water pace ramps, HRV-based priming routines) they build an efficiency buffer that amplifies every watt and every stride later. 

The real breakthrough is reframing “stay relaxed” from vague advice into “performance economics”. When you quantify calmness, you teach athletes to treat composure as a skill with measurable ROI. A smoother swimmer isn’t just more comfortable. They’re neurologically efficient, oxygen-efficient, and metabolically stable. They exit the water with access to more power, more control, and more resilience for the hours ahead. 

As the data shows, fitness gives capacity, but calmness governs cost. And on race day, the athlete who manages cost always beats the athlete who merely survives.

Teresa Catita

Editor and Writer

Portugal’s Pride or Saudi Arabia’s Asset? The New Identity of Cristiano Ronaldo 

Reading time: 8 minutes

Cristiano Ronaldo is indisputably the most recognized Portuguese person in the world. Thanks to his abilities and performances in football, as well as the global brands he and his name have created, owning more than five companies, from clothing to hotel chains, he is an influential personality who makes an impact wherever he appears, whether on the pitch or at the White House, as he did last week. Since 2002, when he joined Sporting, he began stepping onto the world stage, carrying Portugal’s name to all corners of the globe. But can Ronaldo be considered a Portuguese ambassador, or is he a brand that can be bought and owned by others? 

Image 1- CR7 in an Al-Nassar game 

Ronaldo’s impact extends far beyond the football pitch, he has become an unofficial ambassador for Portugal, shaping how the world perceives the country. His success brought unprecedented visibility to Portuguese culture, language, and identity, often sparking global curiosity about his origins and upbringing. Tourism campaigns have leveraged his image, and Madeira, his birthplace, has experienced a noticeable increase in international visitors partly due to the global popularity he helped generate. This was evident in a study published in 2021 by the researchers in the Centre for the Study of Geography and Spatial Planning of the Faculty of Arts of the University of Coimbra (FLUC), the study emphasizes that Madeira Island “was consecutively elected” as “Best destination Island in Europe” between 2013 and 2021 (only with the exception of 2015) and, cumulatively, “Best Island Destination in the World” between 2015 and 2020. Adding that “the notoriety of Cristiano Ronaldo influences a whole chain of attitudes, reactions and personal and social behaviours with a positive impact on tourism in Madeira”. The study conclusion was that Ronaldo contribution was important for the island and that he should be used as a role model for other known Portuguese figures to promote their Portuguese home cities and regions. Even in moments of tragedy, Ronaldo image was spotted and helped to raise awareness to the cause. This is the example of “Martunis” an Indonesian boy that was found alone and malnourished in a beach in Indonesia, after the 2004 tsunami that hit Indonesian. The boy was spotted using a Portuguese jersey with the name Ronaldo in the back, the story gains immense media coverage and raise a lot of attention to Indonesia, even leading to CR7 to visit the country and becoming “godfather” of the little boy “Martunis”, sponsoring his studies and career.  

Image 2- Ronaldo meeting Martunis

However, in recent years, Ronaldo’s move to Al Nassr also placed him at the centre of Saudi Arabia’s ambitious global rebranding efforts. Beyond playing football, he has become one of the country’s most visible cultural promoters, appearing in campaigns that encourage tourism and international investment. While this is part of his contractual obligations as a global athlete, it inevitably raises questions about how far a personal brand can be integrated into the strategic interests of a nation. The scale of his salary and commercial responsibilities suggests that Saudi Arabia did not just sign an athlete, they acquired a symbolic asset capable of shifting global narratives. These suggestions came since Saudi Arabia has been attempting to reshape its global image amid international criticism of certain policies, such as restrictions on civil liberties, the treatment of dissidents, and human rights concerns frequently raised by global organizations. These issues have at times overshadowed the Kingdom’s efforts to present itself as a modern, forward-looking nation. Ronaldo’s visibility, charisma, and global following provide Saudi Arabia with a powerful cultural tool that can redirect attention toward tourism campaigns, entertainment initiatives, and economic reforms presented under Vision 2030. While Ronaldo himself is primarily fulfilling the professional and promotional obligations of his contract, his presence inevitably becomes part of a wider attempt to soften international criticism and project a more positive image. 

Although, joining Al-Nassar in 2023, the past week Cristiano Ronaldo made headlines by visiting the White House alongside Saudi Arabia prince Mohammad bin Salman and his delegation. The visit aimed to formalize the trade deal between the U.S. and Saudi Arabia of 300 U.S. made tanks and the 1 trillion investment guarantees from the Saudi’s. Nevertheless, what was most reported from the meeting between the two countries was the dinner, that featured Cristiano Ronaldo as an ambassador of Saudi Arabia. Ronaldo’s presence blurs the line between being an ambassador by choice and being a figure whose image has been strategically “purchased” to serve broader political and economic objectives. In Portugal, a heated debate arises. For some Portuguese, like the President of the Regional Government of Madeira, Ronaldo´s trip brought pride to Madeira, since he represented the region and Portugal near the most powerful men of the free world. Nonetheless, some political commentators wrote and openly stated that the visit was an “embarrassment” for them as Portuguese people, with Elma Aveiro, Ronaldo’s sister, responding to the criticism from commentators like João Maria Jonet that said live in “SIC Notícias” that he was “shocked” with Ronaldo visit. Even Ricardo Araujo Pereira ironically commented on the situation, saying in his Sunday show: “What would D. Afonso Henriques, founder of Portugal, that fight the moors to gain independence, say seeing Portugal biggest personality in the white house representing Saudi Arabia, home of the founder of Islam”.  

Image 3- Ronaldo receiving the White House Key 

To conclude, Cristiano Ronaldo’s trajectory from global sports icon to a figure intertwined with Saudi Arabia’s political and economic ambitions illustrates the increasingly complex relationship between celebrity, national identity, and international power. His presence at events of geopolitical significance shows how his image now functions far beyond the boundaries of sport, becoming a tool capable of lending visibility and legitimacy to the agendas of states. This dual role has intensified debate within Portugal, where admiration for Ronaldo’s achievements coexists with discomfort over the symbolic weight his endorsements carry. Ultimately, Ronaldo’s case exposes the delicate line between personal success and political appropriation, raising broader questions about how much control public figures retain over their own narratives once they become global brands embedded in international strategies. 

Sources :

Guilherme Mendonça  

Writer