
Part II: A small nudge for man, a giant leap for mental health
Where do nudges come in?
We’ve talked about how widespread mental health struggles are and how important it is to pay them proper attention. It is particularly necessary to drive people into taking better care of their mental health, as well as end the stigma around mental issues. We will now examine the idea of how behavioral economics can be used for these purposes, namely through nudges.

But what, exactly, is a nudge? According to Thaler and Sunstein, the creators of the concept, “a nudge is any aspect of the choice architecture that alters people’s behavior in a predictable way without forbidding any options or significantly changing their economic incentives”.
Many of those struggling with their mental health do not seek the needed treatment. This may be related with the implications of these issues in decision making, which help-seeking models and interventions often fail to account for.
This is exactly where Behavioral Economics comes in. It can help reduce engagement in behavior patterns that represent risk factors in the development of mental problems and provide the necessary and adequate frameworks for incentivizing help-seeking by individuals affected by them. Nudges can, therefore, be a complementary and cost-effective strategy for suicide and mental health issues prevention, both by tackling risk factors and by effectively encouraging individuals to seek help.
But what would such interventions look like? Well, it is necessary to understand that both the field of behavioral economics and our current generalized concern with mental health issues are still very recent. Therefore, they are still in the earliest stages of development, and studies can be costly and hard to implement, so no widespread intervention has taken place so far. Still, there is no lack of initiatives out there!

Dodging the risks
Ashleigh Woodend, Vera Schölmerich, and Semiha Denktaş, in their article “Nudges to Prevent Behavioral Risk Factors Associated With Major Depressive Disorder”, look at what they call risk factors, behavioral patterns which can increase the odds of developing mental health problems (or worsen existing ones), and propose a series of nudges that could be effective in tackling them. Those negative behaviors include low physical activity, since exercising has a strong positive impact on mental well-being (it releases dopamine and improves self-esteem), inappropriate stress coping mechanisms, as stress can be a powerful trigger of mental health problems, and inadequate maintenance of social ties, as healthy social interaction promotes psychological wellbeing (if the pandemic has taught us anything, is that social isolation and mental health are no friends!).
Nudges play on our cognitive biases. One such bias is our tendency to prioritize immediate reward over gains in the distant future. For example, how many times have you allowed yourself “just five more minutes” of sleep in the morning, even though you knew it would make you late for class? What if we could use this effect to make us want to get up and increase our physical activity? This can be done through a nudge called temptation bundling, combining an unpleasant activity with a pleasant one.
For example, regarding the improvement of physical activity habits, you can try to fuse that unappealing morning run with something you will enjoy, like hanging out with friends or listening to some music. Or, if a trip to the gym seems like a punishment, throw in an episode of your favorite show. These are easy ways to nudge yourself into building an active lifestyle pattern.

Another great way to nudge behavior is by fiddling with the phrasing of the message we are trying to convey. It has been shown that positive framed messages are more effective than negative framed messages in promoting prevention behavior. So, putting up a sign with a phrase like “If you meditate, you reduce your risk of mental health problems” is more likely to get people some quiet time with their own thoughts than one phrase saying “If you don’t meditate, your risk of depression will increase”.
When you go to the beach, do you wear sunscreen? And what if, on your way there, you notice a sign pointing out that without protection, you are likely to get sunburnt within half an hour of direct sunlight? Will you wear it now? Most people will. This is called a salience nudge, where some characteristic of a choice is brought to your immediate attention, “put under the spotlight”, in order to influence that same choice. And this can be done to decrease the risk of mental issues too. By simply highlighting, in the workplace, for example, that a significant number of people have engaged in stress management training, it is possible that more people will try it as well, learning appropriate coping mechanisms to keep their minds as healthy as possible through the difficulties that may come their way.
You are probably familiar with the feeling of meaning to do something but never actually getting to do it. Sure, you will read that book you’ve been wanting to read, catch up on your microeconomics study before the midterm gets too close, or finally try to chat a bit with your coworkers and get to know them better. Eventually. The thing is, we are not very good at moving away from the status quo, i.e., we tend to stick to the current state of things and struggle to find the drive to make changes in our lives and environment. So, if we want to stimulate social interaction, it is better, for example, to create an environment where that is the default option rather than something towards which people have to make an effort.

It may be possible, for example, to change the typical workspace from a place with little to no person-to-person engagement into one of sociability, by adopting an open office model. We would be nudging individuals towards building connections by creating an opt-out system of personal interaction instead of an opt-in – a system requiring extra effort to dodge interaction instead of one that requires extra effort to engage in interaction.
So, there are ways to nudge people away from behavior patterns that can be detrimental to mental health. But what can nudges do to help those already in mental distress?
Seeking Help
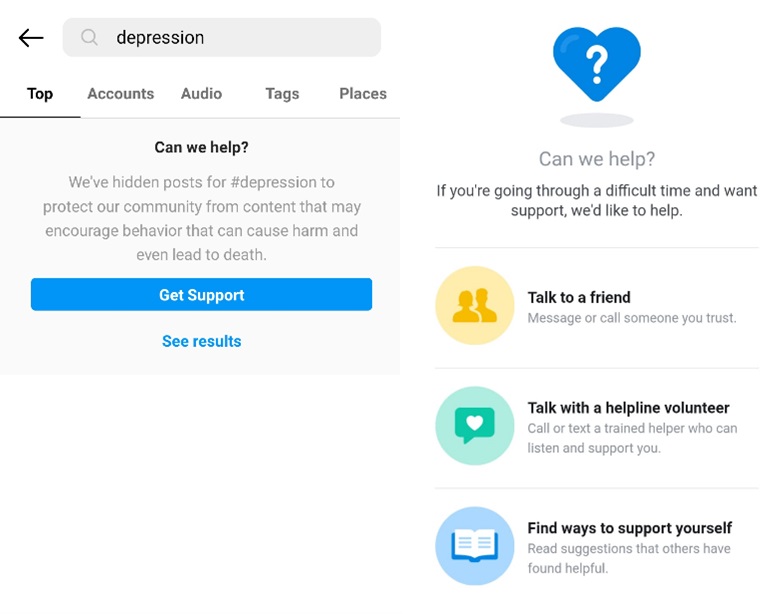
In these situations, the best to do is to guide someone towards seeking proper help. Instagram, for example, takes preventive measures when users search for a #depression hashtag: a screen pops up redirecting them to help (this will also work with other mental health related searches, like self-harm). A similar thing happens when someone googles depression or suicide. These are small nudges towards the right path, tailored to those who need them the most.
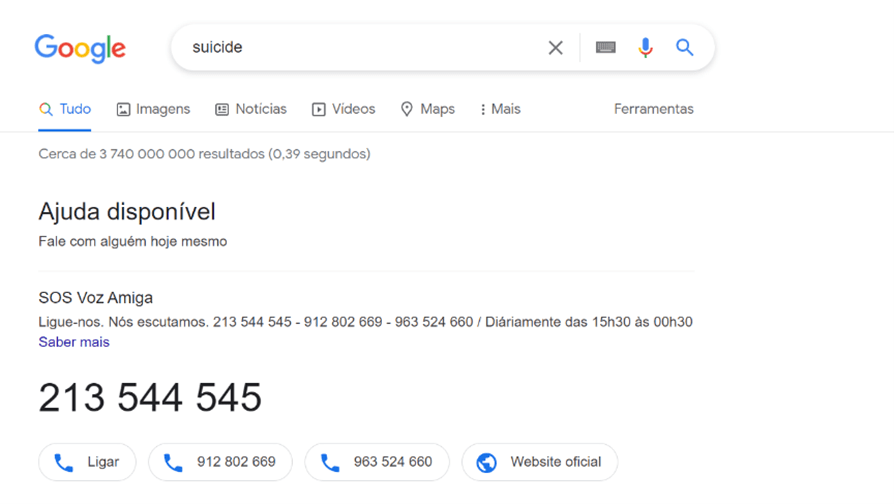
Help Available
talk to someone today
SOS Friendly Voice 213 544 545
The last mechanism we want to outline is a particularly clever and effective one (as obvious as it may seem): social norms (1). Humans have a strong tendency to follow the norm, tied to a desire for others’ approval. Social norms have been proven to predict behavior patterns. Hence, it is plausible that greater awareness of others recurring to mental health treatment and overall shows of acceptance of those who do it can increase help-seeking behavior. Normalizing the problem can help solve it.
(1) If you want to know more about this topic check out our article about peer pressure influence click here.
Authors’ Note:
We are writing this article as more of an exploration of the power of behavior economics in the prevention of mental health issues and in easing the burden of those already struggling with it than as simply an awareness-raiser to the problem. However, awareness for these issues can never be too much, both in society in general and in the academic community, so we lay out some of the signs to watch out for and urge you to reach out to your friends/loved ones if you notice these signs in them, and to seek help if you feel them yourself.
Sources: Mental Health Foundation, World Population Review, World Health Organization, WebMD, Yale University, PubMed Central, Medium, SAGE Journals, IZA World of Labor, Recovery Ways.

Leonor Cunha

Mariana Gomes

Constança Almeida